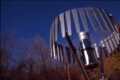
Here comes the sun (at our field site)
Credit: Laura Busato
By Laura Busato, Siptenfelde and TERENO observatory Harz/Central German Lowland
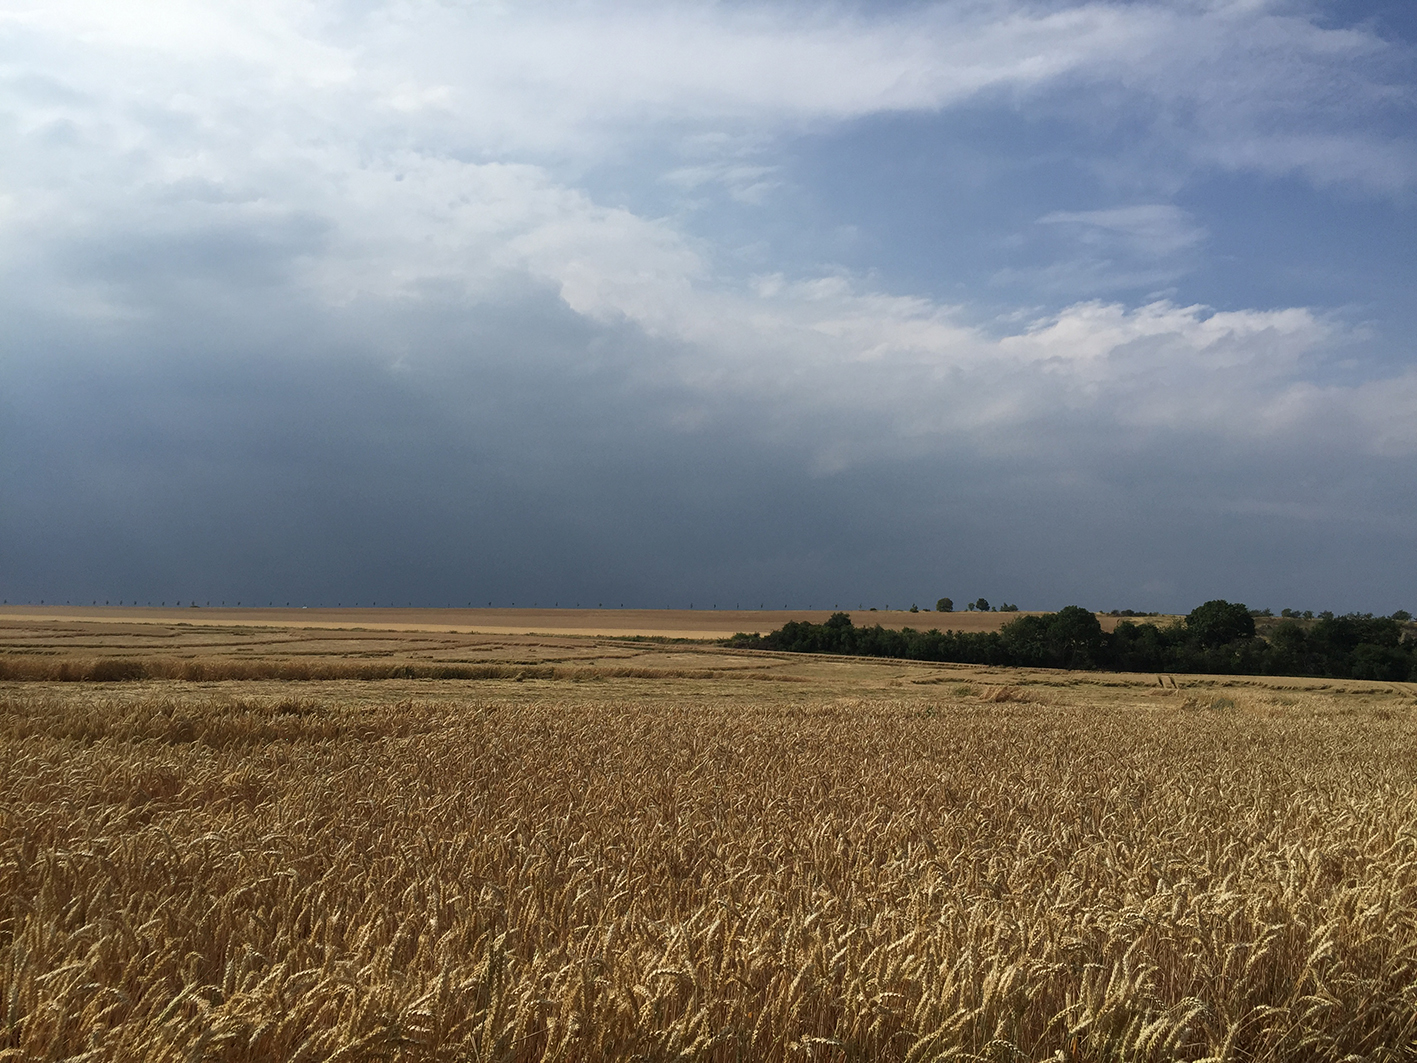
My second time in Germany starts on a hot and sunny summer day. After a short meeting with researchers and technicians from the Helmholtz-Centre for Environmental Research in Leipzig, and some instrumentation checking, me and the other group member are ready to reach the TERENO field site near the Selke River, in Saxony-Anhalt. But why are we here? Let’s take a step back!
A layer of water-bearing permeable rock or soil from which water can be extracted is called “aquifer” and its characterization is important for many reasons, especially for human use. From a wider point of view, aquifers belong to the so called Earth’s Critical Zone, the thin outer layer of our planet where interactions between soil, water, rock, air, and living organisms take place. Each aquifer has its own characteristics (some are shallow and some are deep, some are confined and some are unconfined…) but all of them can be characterized using the same methods, which are actually a lot. So that’s why we are here: to study a shallow fresh water unconfined aquifer!
An audience gathers as we take our measurements.
Credit: Laura Busato
This aquifer in the Central German Lowland is already well known from the UFZ group in Leipzig, as many data are already available, but when it comes to aquifer characterization (or any other thing in any other science field) data are never enough! Furthermore, this case study is a good example of the combination of the two main types of field information: direct and punctual vs. indirect and extensive. But what does this mean?
The first type of information (direct and punctual) comes from the typical approach to aquifer characterization, based on observation wells. They are drilled from the surface into the aquifer and are equipped with many types of probes, which automatically measure several parameters like electrical conductivity, temperature, and so on. In our field site we took advantage of the direct push-system, which pushes tools and sensors into the ground to create a borehole and, simultaneously, creates a log measuring several parameters at different depths. On the other hand, the second type of information (indirect and extensive) consists in measuring quantities that are related to the ones we are actually interested in, since determining them directly would be too difficult or too expensive. A good example is electrical resistivity, a physical parameter that depends on many factors (e.g. water content, salinity, temperature, etc.)
Here’s a borehole equipped with several different probes.
Credit: Laura Busato
So the point is: which approach is the best? The choice depends on the characteristics of the area, on the amount of money at our disposal, and, most of all, on the questions that need to be answered. But probably the best solution is to combine the two of them, and this is exactly what we chose for our field site.
The first thing we do is measuring the depth of the water table, i.e. the upper boundary of our unconfined aquifer (or, in other words, the surface separating the water-saturated soil – below – from the unsaturated soil – above). Water table depth varies over time depending on many factors and gives us information regarding the direction of groundwater flow. These direct measurements rely on the number of observation wells available, which are usually a few, as they may be too expensive and/or may modify the actual aquifer properties. Therefore, these punctual values are then properly combined to infer information also on the area between these wells, thus leading to a so-called “isophreatic map” (i.e. a map showing how the water table depth varies in the space, like a topographic map shows altitude variations)
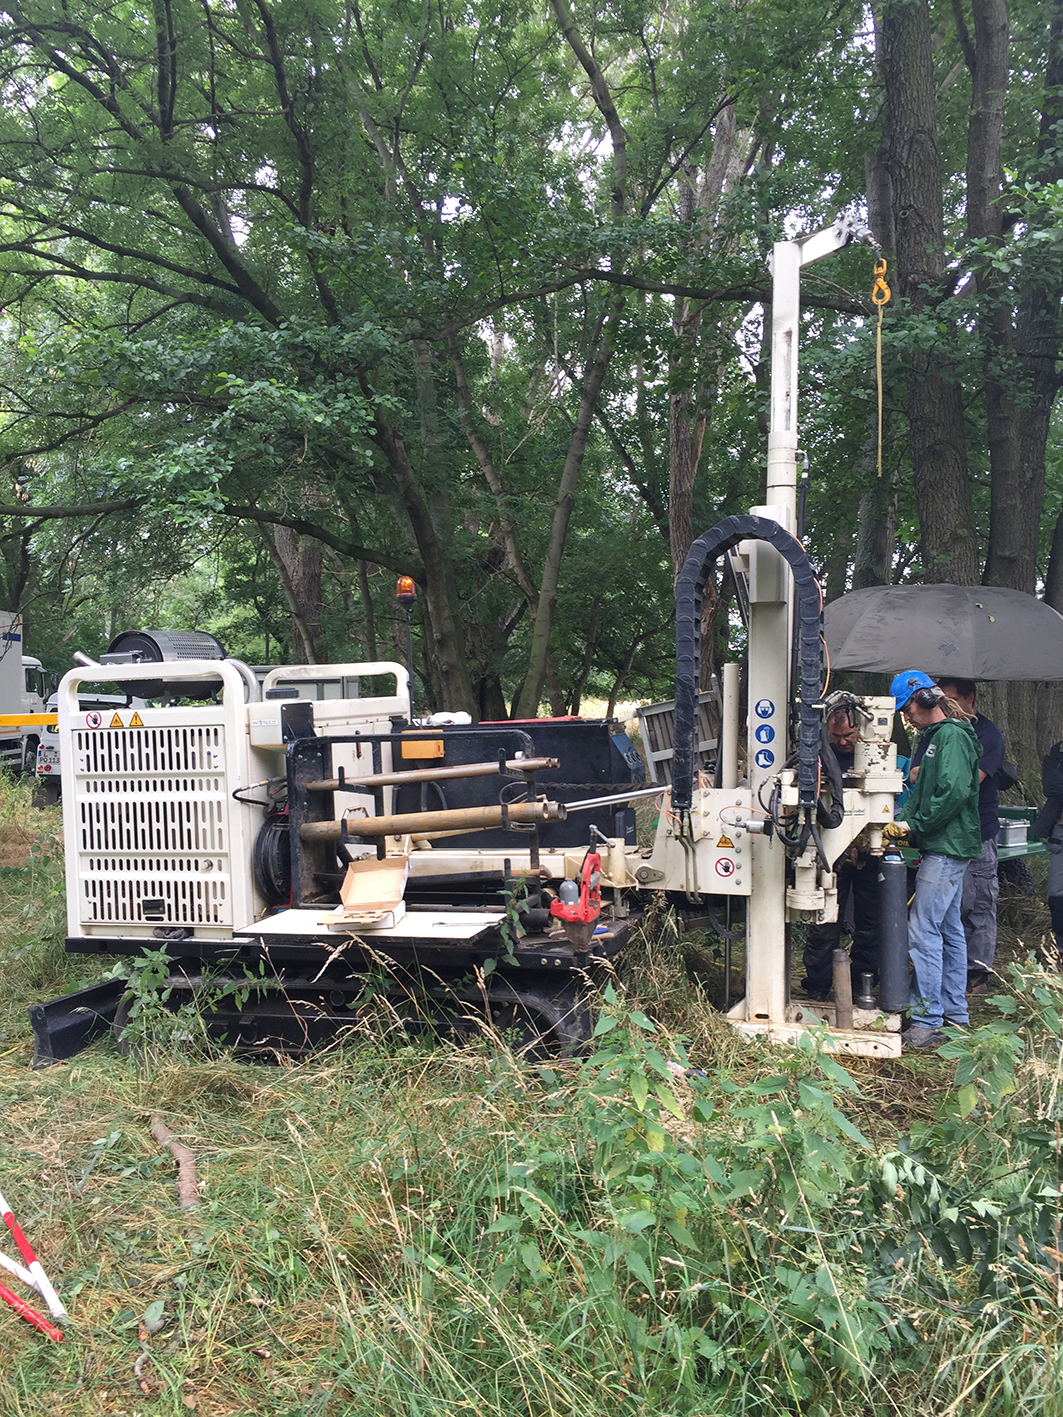
The “Geoprobe” direct push system drilling one of the boreholes for the ERT measurements.
Credit: Laura Busato
The second thing we do is a tracer test, to gather indirect and extensive information. Tracer tests consist in injecting a substance that can be easily detected (why appropriate tools) into the aquifer, to monitor how it changes the properties of the investigated domain. In our case, this consists in injecting a certain amount of water with a known electrical conductivity (i.e. the inverse of electrical resistivity) and to monitor how electrical resistivity and electric potential difference vary consequently over time.
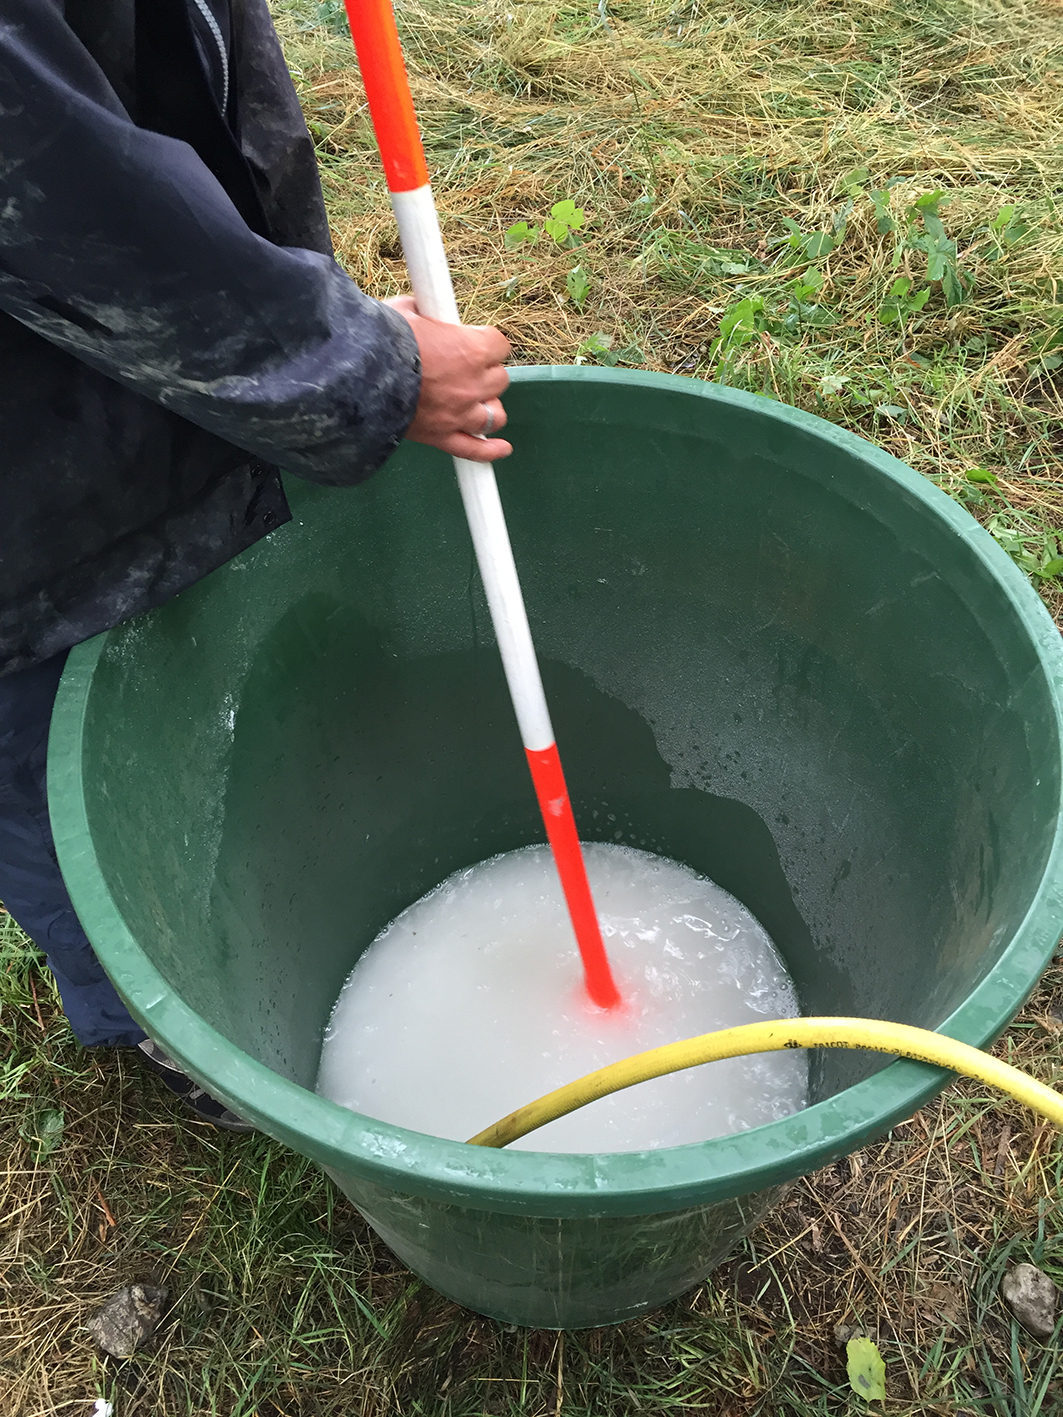
Mixing of water from Selke River with salt (NaCl, sodium chloride) to obtain the tracer with known electrical conductivity for the tracer test.
Credit: Laura Busato
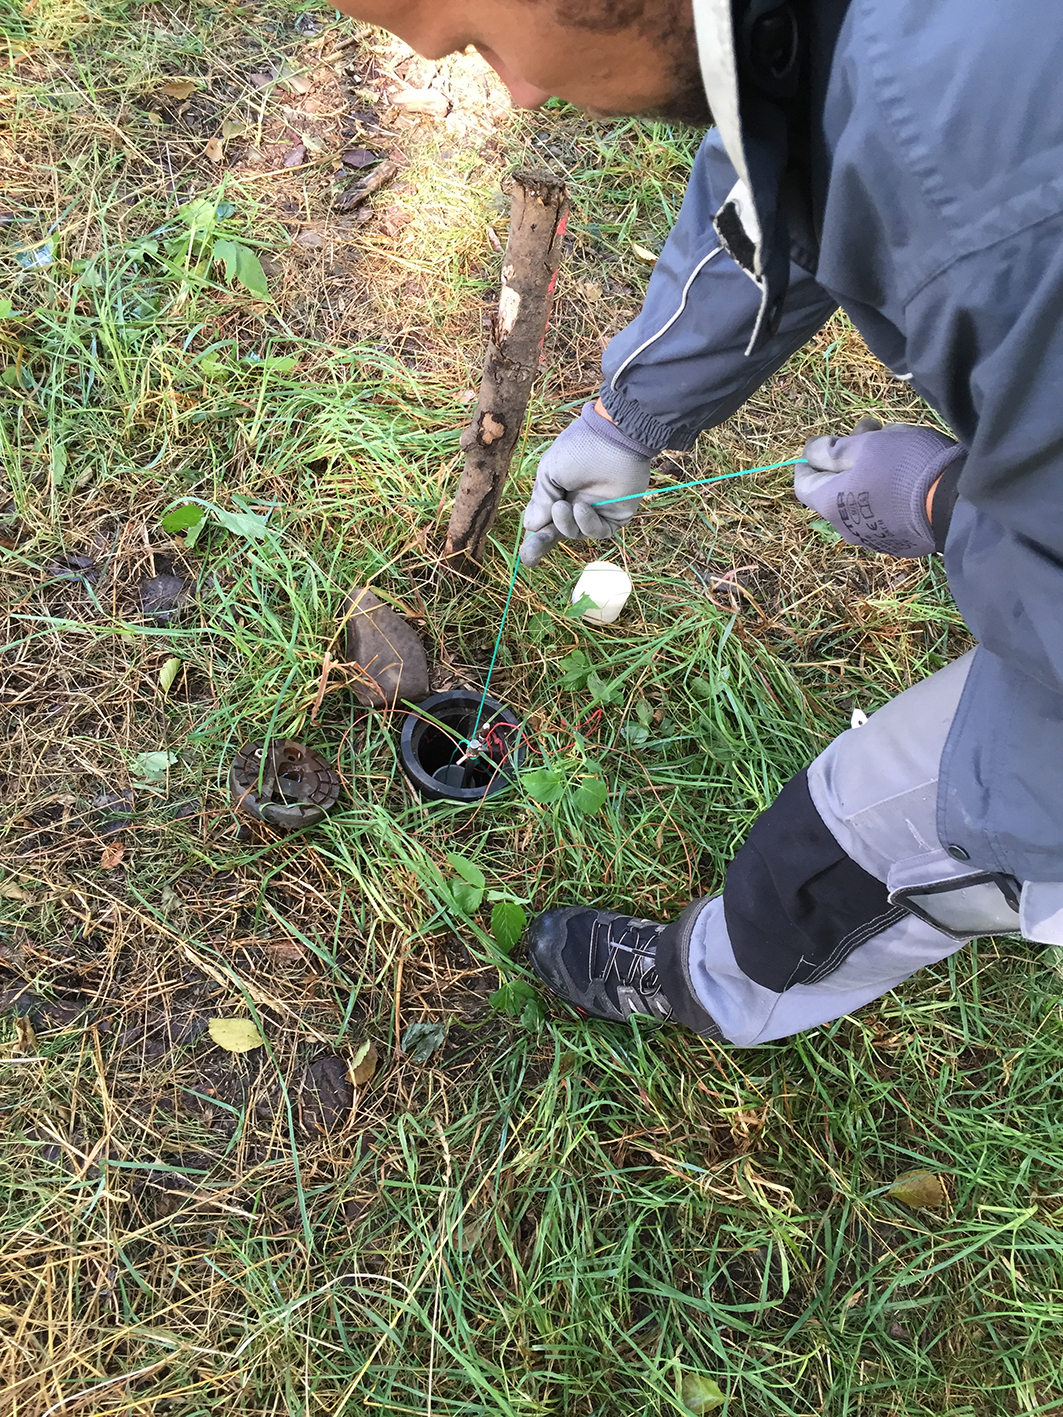
To measure these physical quantities, we decided to combine two different methodologies, named electrical resistivity tomography (ERT) and mise-à-la-mass (MALM) respectively. Even if their names seem complicated, their application is rather simple. The former consists in injecting electrical current into the subsoil and measuring the generated corresponding voltage, using several metallic elements called “electrodes”. We put these electrodes directly into the aquifer thanks to four new boreholes. The voltage values are then turned into the corresponding electrical resistivity, which is finally represented into images known as resistivity cross-sections. These pictures show the resistivity pattern at the measurement time, as if we were cutting a vertical slice in the soil (perpendicular to the ground surface) among the boreholes. These resistivity values can be related to the direct information obtained from the observation wells, so as to extract only the information we are actually interested in.
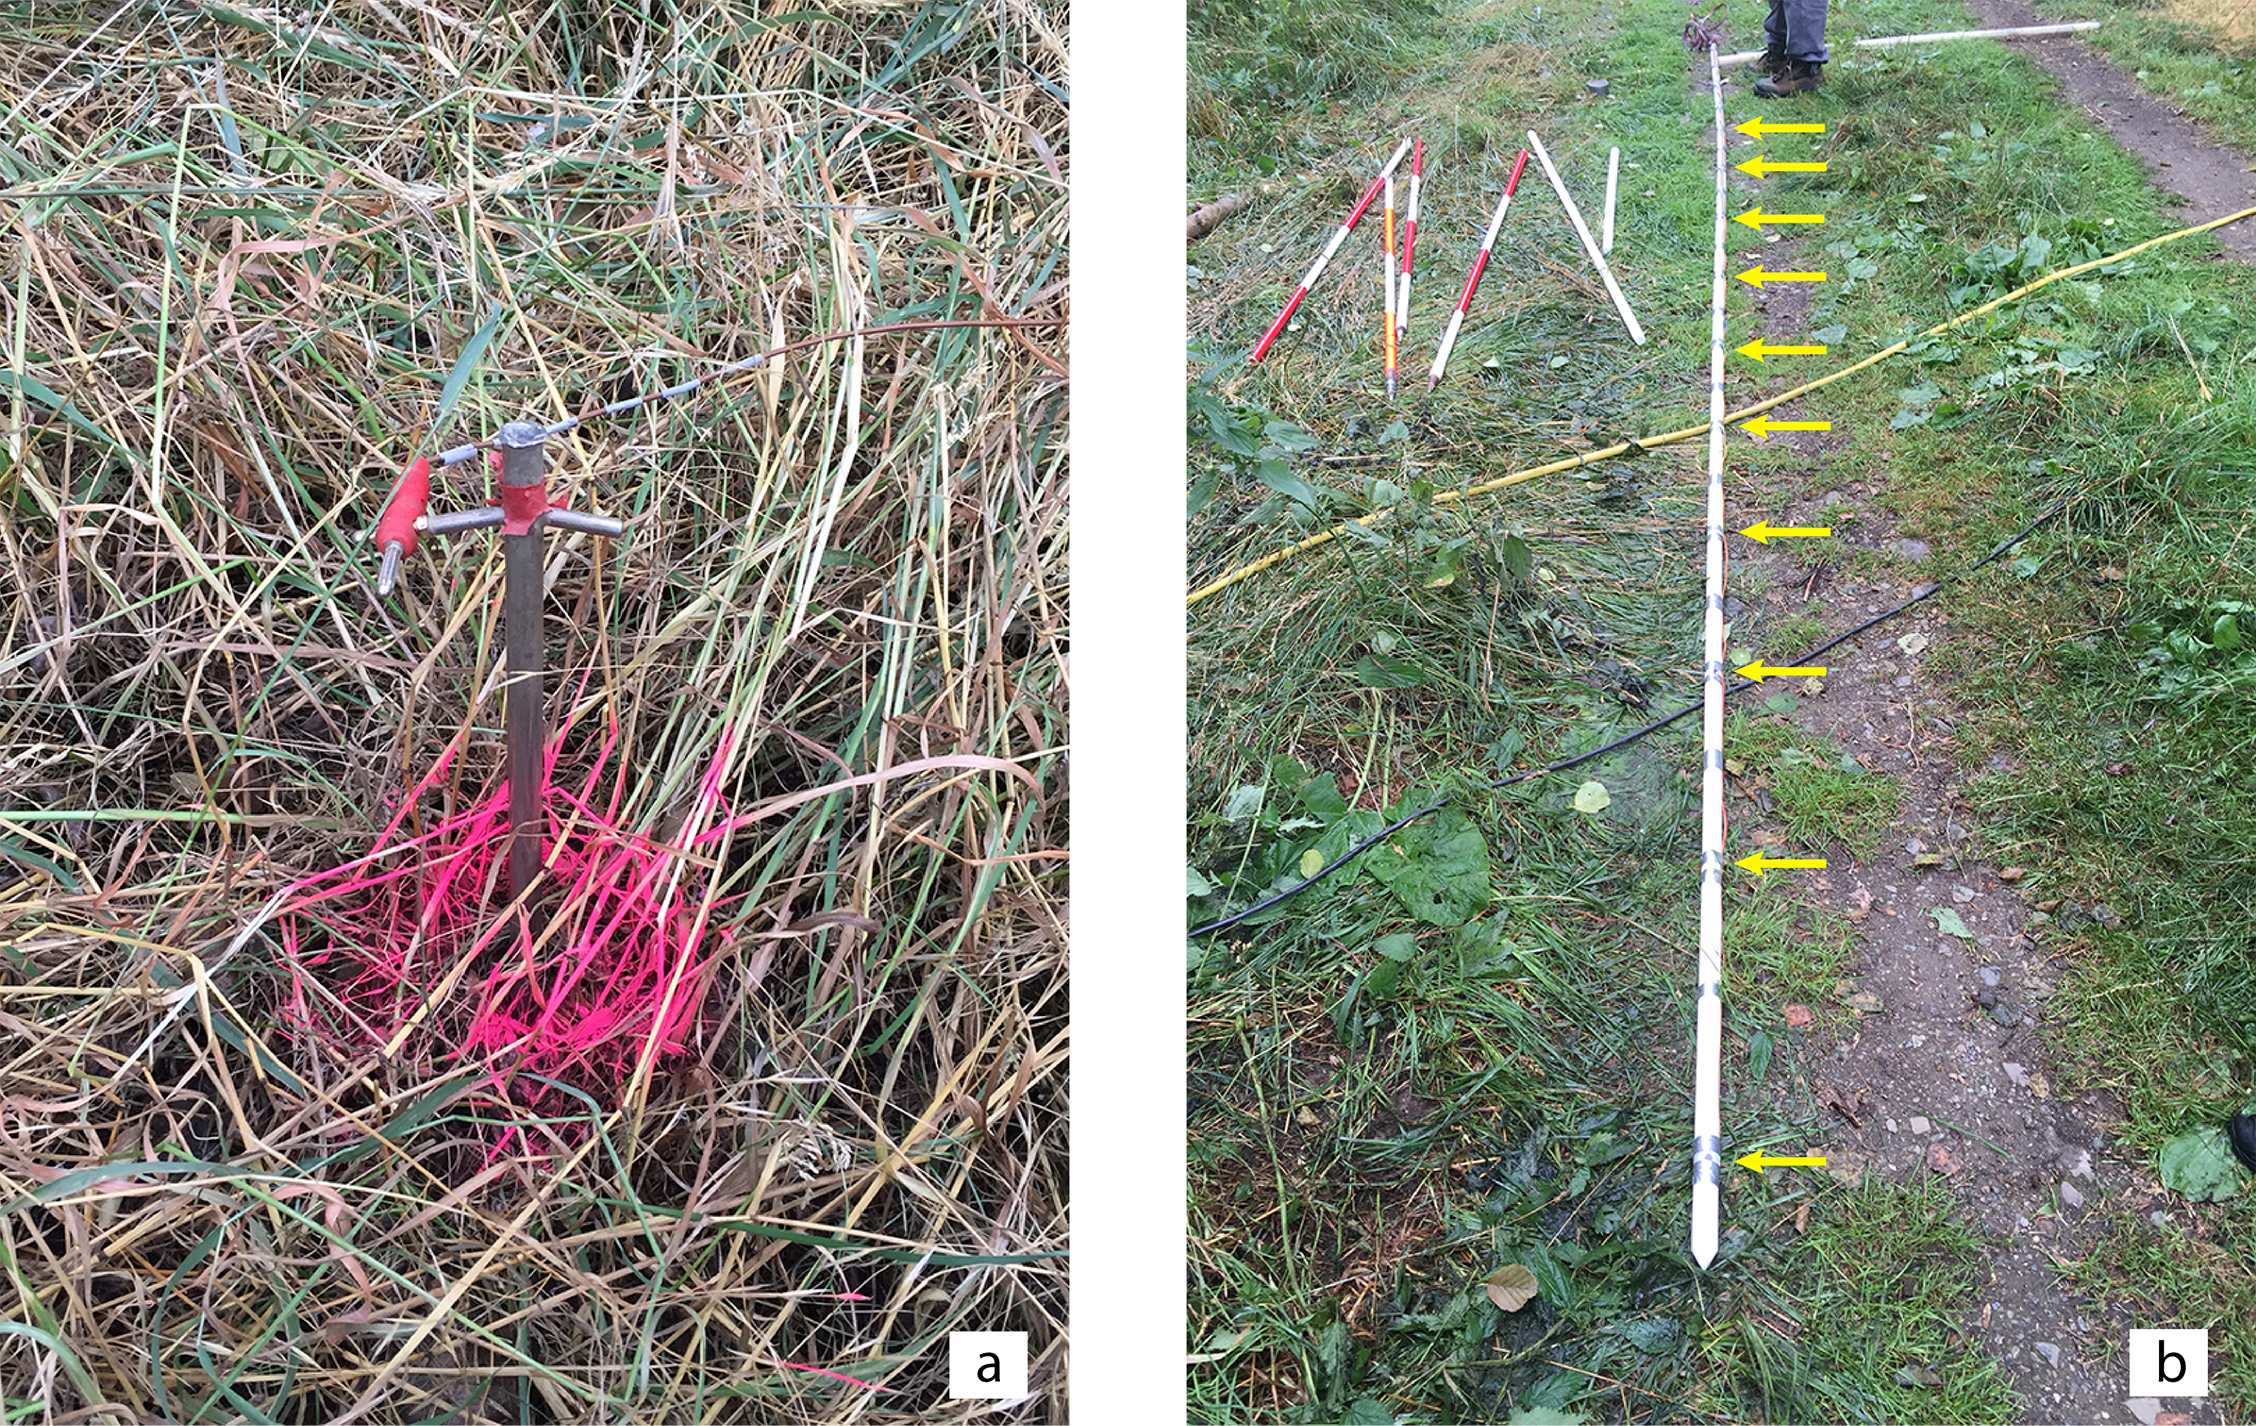
a) Surface stainless steel electrode for MALM measurements and b) plastic pipe with ten borehole electrodes (each one indicated by a yellow arrow). Each electrode is wrapped around the pipe, which is the inserted into one of the boreholes. Each of the four boreholes for ERT acquisitions is equipped with a plastic pipe with ten electrodes like this.
Credit: Laura Busato
The latter methodology is based on the same principle, i.e. injecting electrical current and measuring the corresponding voltage. In this case our electrodes are placed on the ground surface, creating a sort of grid covering the area over which the tracer should move: here, the aim is obtaining a voltage map, which represents how voltage varies in the space of the investigated area. The main idea is that the tracer varies the measured voltage (and therefore also resistivity) over time, according to its movement, which depends on the aquifer properties. Thus, the detection of these variations should provide insights regarding the investigated domain, such as direction and flow velocity.
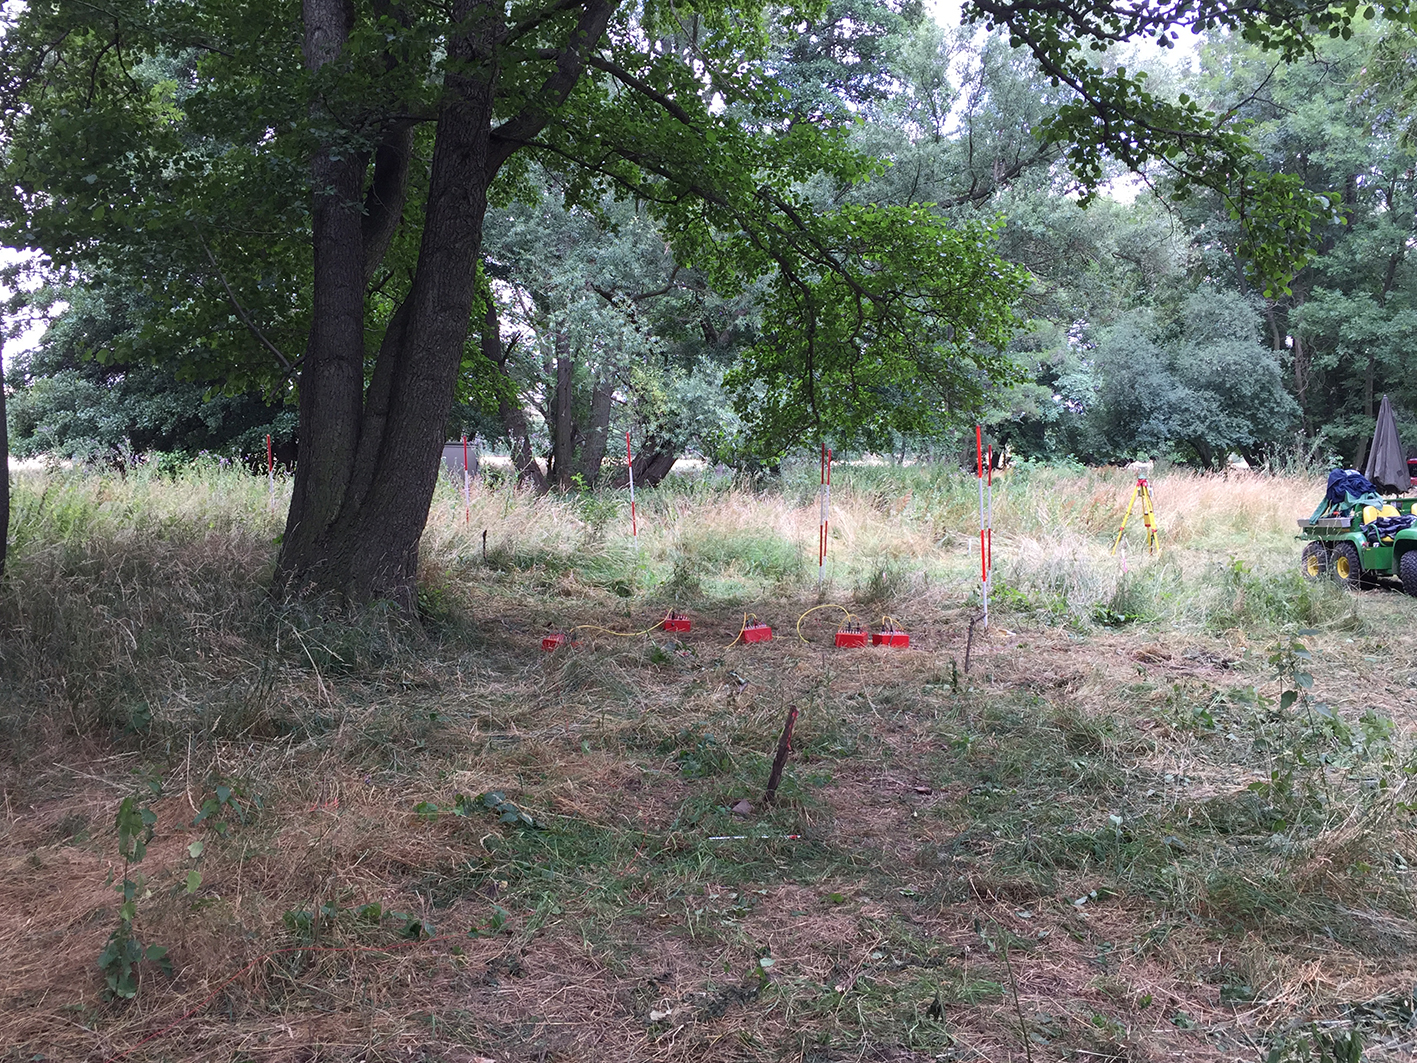
Field site in the Harz/Central German Lowland. The red boxes allow the connection between the boreholes and the automated instrument carrying out the ERT acquisitions, while the red and white poles indicate the position of some of the surface electrodes for the MALM measurements.
Credit: Laura Busato
Even if the data analysis will require some time, as combining all this information together is not so simple, the preliminary results are definitely promising. Our goal is to assess the same direction and flow velocity both from surface (i.e. MALM) and borehole (i.e. ERT) acquisitions. Thus we will be able to say that, yes, sometimes one can judge an aquifer only from the surface!
 Laura Busato is a PhD student at the University of Padova (Italy). She combines non-invasive geophysical methods and hydrological models to characterize the movement of water in the Earth’s Critical Zone (i.e. the thin, outer layer of our planet, where the interactions between air, soil, water, rock, and living organisms take place). She really likes listening to rock music and baking cakes.