ian_image1-e1573696286251
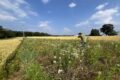
Figure 1. Ian Yesilonis by a large tulip poplar tree in Gwynns Falls/Leakin Park in Baltimore City.
Figure 1. Ian Yesilonis by a large tulip poplar tree in Gwynns Falls/Leakin Park in Baltimore City.
Components of the N cycle investigated by using 15NH4+ dilution method and isotopic enrichment of other N pools.
An overhead view of recirculating chambers.
Kings Creek during normal flow.
Molly Fisher checking the dissolved oxygen level of a recirculating chamber during 2018 fieldwork.
Penny, one of the lovely station pups.
The amazing team that worked on this project. (Left to right: Logan Kozal, Kelly Speare, Marie Strader, Terence Leach and Jannine Chamorro)
Corals demonstrated drastic differences in bleaching severity.
Researchers, Kelly Speare and Marie Strader, collecting coral colonies.
Climate models of changes in ecosystem carbon and nitrogen with increases in temperature. Black, dotted line represents a model where vole effects are “Aggregated” with other biogeochemical processes. Red dashed line represents a model with constant vole density (100 voles per hectare). Blue solid line represents a model with a simulated “Vole cycle,” in which vole abundance fluctuates with peaks every 3-4 years based on demographic patterns observed in wild populations. When voles aren’t explicitly accounted for (aggregated, dotted black line), the model underestimates shifts in carbon and nitrogen stocks.