mcm-fun-power
Meredith Snyder (left) and Dr. Jesse Jorna (right) having fun while sampling in the Fryxell Basin.
Meredith Snyder (left) and Dr. Jesse Jorna (right) having fun while sampling in the Fryxell Basin.
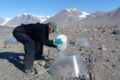
Dr. Sarah Power (right) and Meredith Snyder (left) sampling in the Dry Valleys. This photo shows the microtopography of the dry valleys. The polygon cracks (bottom left) accumulate salt and moisture.
Photo of biocrust in the Dry Valleys. The biocrust is the dark grey/black colored material on top of lighter soil.
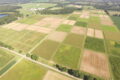
Map of Antarctica. The Dry Valleys are circled in red on the map of Antarctica. The Fryxell Basin, where Dr. Power’s study was conducted, is shown in the image on the right.
Photo of “fall” (mid-August) in the Arctic.
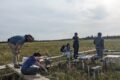
Amelia Harris spreading fertilizer in a long-term fertilization experimental site.
Photo of Frances Cohen, Amelia Harris, and the terrestrial research assistant, Savannah Kjaer on the still frozen Toolik Lake
Flowers thrive within a greenhouse at the Arctic LTER. These are Mountain Avens (Dryas octopetala). Researchers use these greenhouses to simulate the effects of a warmer climate on tundra plants. The CoRRE Database contains data from experiments such as this one across the globe.
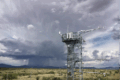
Stormy skies at the Konza Prairie LTER.
Limestone on a spring prairie Site:Konza Prairie Biological Station Photographer: Jill Haukos