—by Traci Kennedy
“What have sea urchins got to do with climate change?” Asked a student of mine. It was a good question, one that I had asked myself when I was first introduced to Dr. Gretchen Hofmann at the UCSB Hofmann labs.
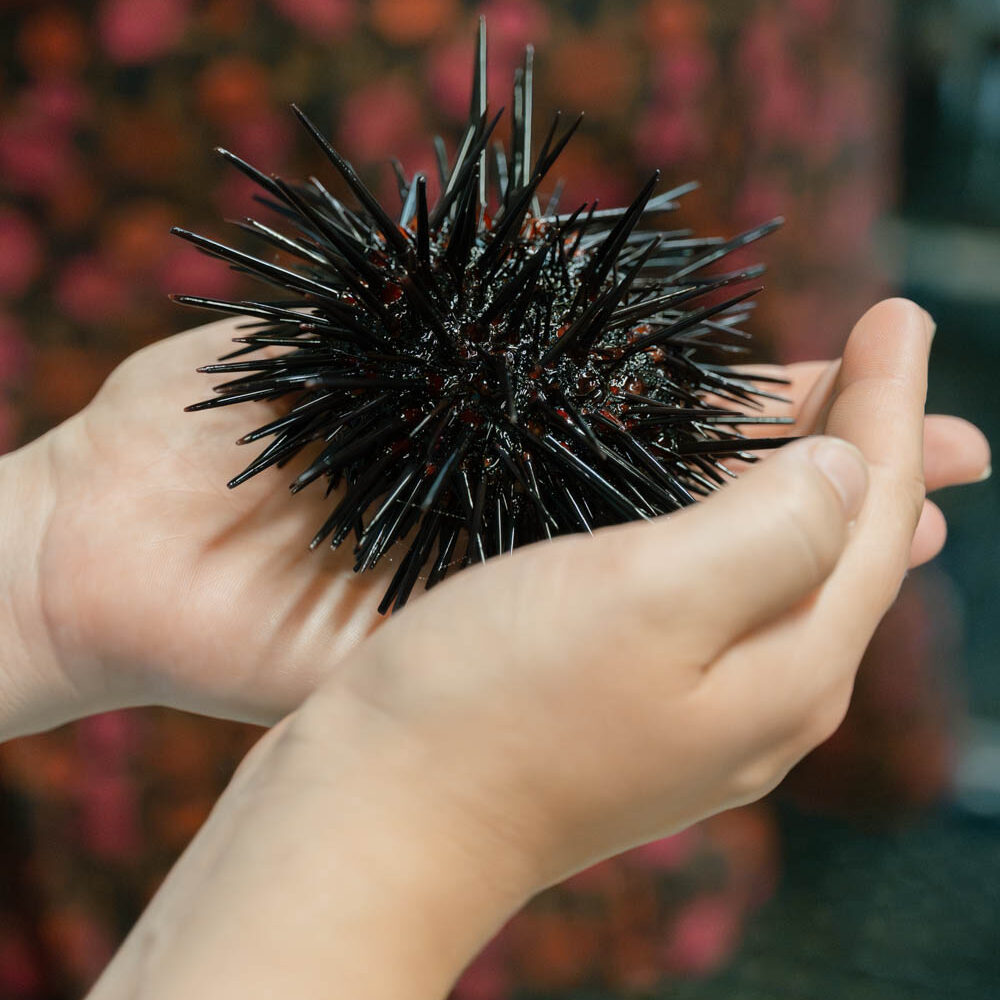
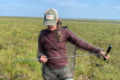
Purple Sea Urchins, or Strongylocentrotus purpuratus, are a nuisance but also a good indicator species. These urchins devastate local ecological systems along the California coast. Another teacher and I studied how to improve our teaching with authentic scientific research. Emily Chittick and I eagerly accepted the chance to experience what the beautiful Santa Barbara area had to offer. More importantly, we wanted to present our Milwaukee, Wisconsin students with authentic research. We hoped this would improve their understanding and love of the scientific process.
Emily and I received this opportunity through grant funding of the LTER and ARETS program. I cannot speak highly enough of this program. I have brought a bit of that experience into my classroom for students in urban Milwaukee, Wisconsin. They now better understand the implications of this coastal species, which affects us all.
A place in the food web
Sea urchins eat algal seaweed and kelp. They eat a LOT of it. This creates something called a sea barren, an area where the producers on the food chain are so depleted that nothing much can survive in those areas anymore. Please see the attached image of a simplified food chain to see the impacts that sea urchins have on the environment.
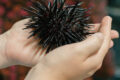
Even knowing that, the question remains: what have sea urchins got to do with global warming? As it turns out, as the waters of the Pacific Ocean warm, the range of the Urchins is climbing northward, into areas where they did not prosper previously. One way that they are able to increase their ecological success is that they have something called a “Righting Behavior”. As waves and other disturbances in the ocean can sometimes displace the urchins, they have a mechanism to return to a better position to continue feeding and other biological processes. Their tube feet will wave around until they find purchase. The tube feet then attach themselves to the substrate and maneuver the urchin to an upright position. Researchers found that the warmer the waters were, the faster the urchins were able to correct themselves. This meant they spent less time in vulnerable positions.
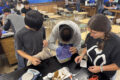
Emily and I spent our days flipping urchins upside down and measuring how long it took them to return to their upright position. We did this at different temperatures that the urchins were acclimated to. Ultimately, we found that the sea urchins did right themselves faster at warmer temperatures, until the temperature was outside of the normal range, at which point the sea urchins seemed to become confused. Some did not even right themselves at all!
Patterns, relationships, and data
My focus in this whole experience has not been about sea urchins at all, but to help my students understand patterns and relationships about things in the world around them, and the implications those patterns may have. So I have been working with my students diligently to understand how to interpret data and graphs to make sense of the underlying patterns.
As part of this research experience, we were introduced to the concept of “data nuggets”. These were other stories about authentic research experiences that produced data for students to practice interpreting. It has been instrumental in my teaching. I use the data nugget stories to increase my students’ understanding of advanced scientific principles. It is my hope that this understanding will improve their scientific literacy, even if they do not go into a scientific field. It will improve and enrich their adult lives.
Satisfying students’ interests
At least once per month, students choose a scientific story that interests them from datanuggets.org. We originally began with a level one version of the data nugget. This includes the background story, the data, the graphs, and the analysis questions. Students then used the completed graphs to answer the analysis questions. The next month, students progressed to a level two version of a different data nugget. Similar to a level one nugget, students had to analyze the graphs AFTER completing the data manipulation and graphing themselves while being provided an outline of what data would be graphed. Students were provided level two opportunities for two months before finally being introduced to a level three opportunity.
The level three data nugget provided the back story, the raw data, and the analysis questions. Students engaged in a productive struggle to come to terms with what data needed to be graphed before they could answer the questions. They were initially frustrated with the experience because it didn’t come naturally to them. Once they understood the analysis questions and what was ultimately being asked and answered, students were better able to complete the graphing.
My students were so proud of themselves when they were able to complete a level three data nugget with very little help on their second attempt. My students are mostly sophomores in high school, and I believe they will be better prepared to take standardised tests where they are intended to interpret graphs. Even more importantly, I believe I am helping them to become scientifically literate adults who will be able to interpret the world around them through a scientific lens.