What would my project be?
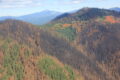
A Minnesota teacher learns about ecological phenomena in the Arctic and connects them to her students — igniting passion and curiosity.
A Minnesota teacher learns about ecological phenomena in the Arctic and connects them to her students — igniting passion and curiosity.
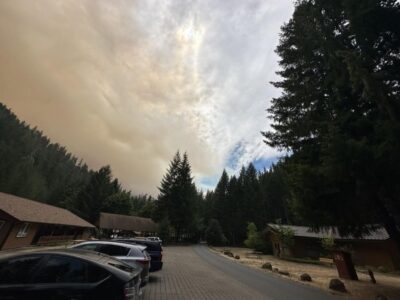
now design lessons where students analyze real datasets, compare short-term and long-term trends, and consider how disruptions—such as wildfire or limited field access—can influence scientific conclusions.
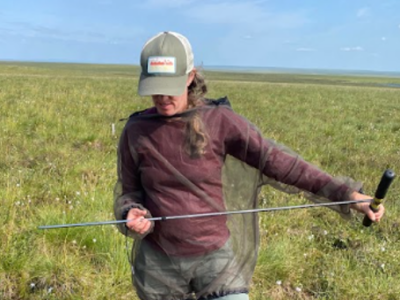
“Science and data collection doesn’t always have to have flashy gizmos and light speed computers… Methodology, consistency, simple tools and flexible minds are gold in the field. Get out there!”
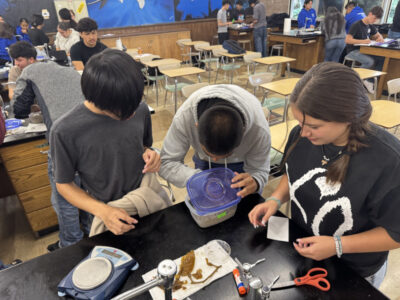
Students engaged in a productive struggle to come to terms with what data needed to be graphed before they could answer the questions.
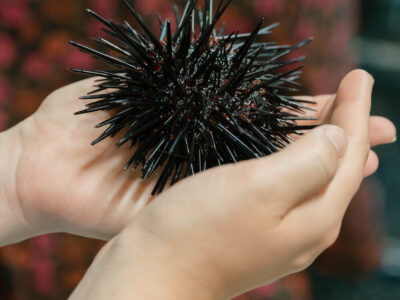
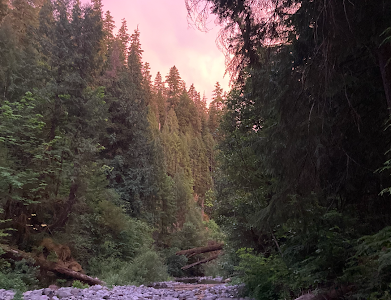
As a native of Santa Barbara, I grew up exploring the tidepools, splashing in the waves, and kayaking the waters that are now part of the Santa Barbara Coastal-LTER. Now, thanks to the ARETs program, I am better equipped to share my knowledge about this special area with my students.
—by Rebecca Hawk If you step inside a classroom, there’s a good chance you will meet a group of funny and interesting kids and an adult who loves spending their days with them. This adult probably joined the education field with a heart full of hope or a fond memory of their schooling days. Sometimes… Read more »
…toward the end of our unit, students were able to create their own graphs, and understand the implications of the data after analysis
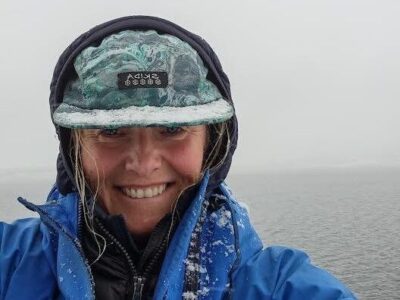
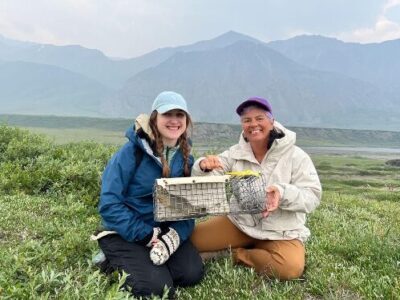
This experience reignited my passion for working with students. Witnessing curiosity, perseverance, and the realities of field research firsthand reinforced inquiry-based learning, systems thinking, and connecting content to real-world science, inspiring both my teaching and my students’ engagement.
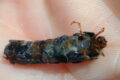
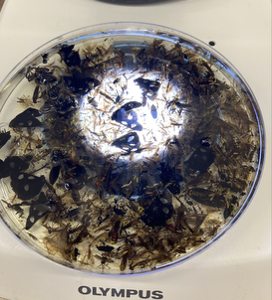
This experience changed my teaching life! Now we learn about insects, collect insects, and identify insects…We even make our own bug costumes after we learn about insect morphology!
…not only were we able to help contribute to the data being collected but also bring that experience back to our students in Minnesota.