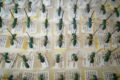
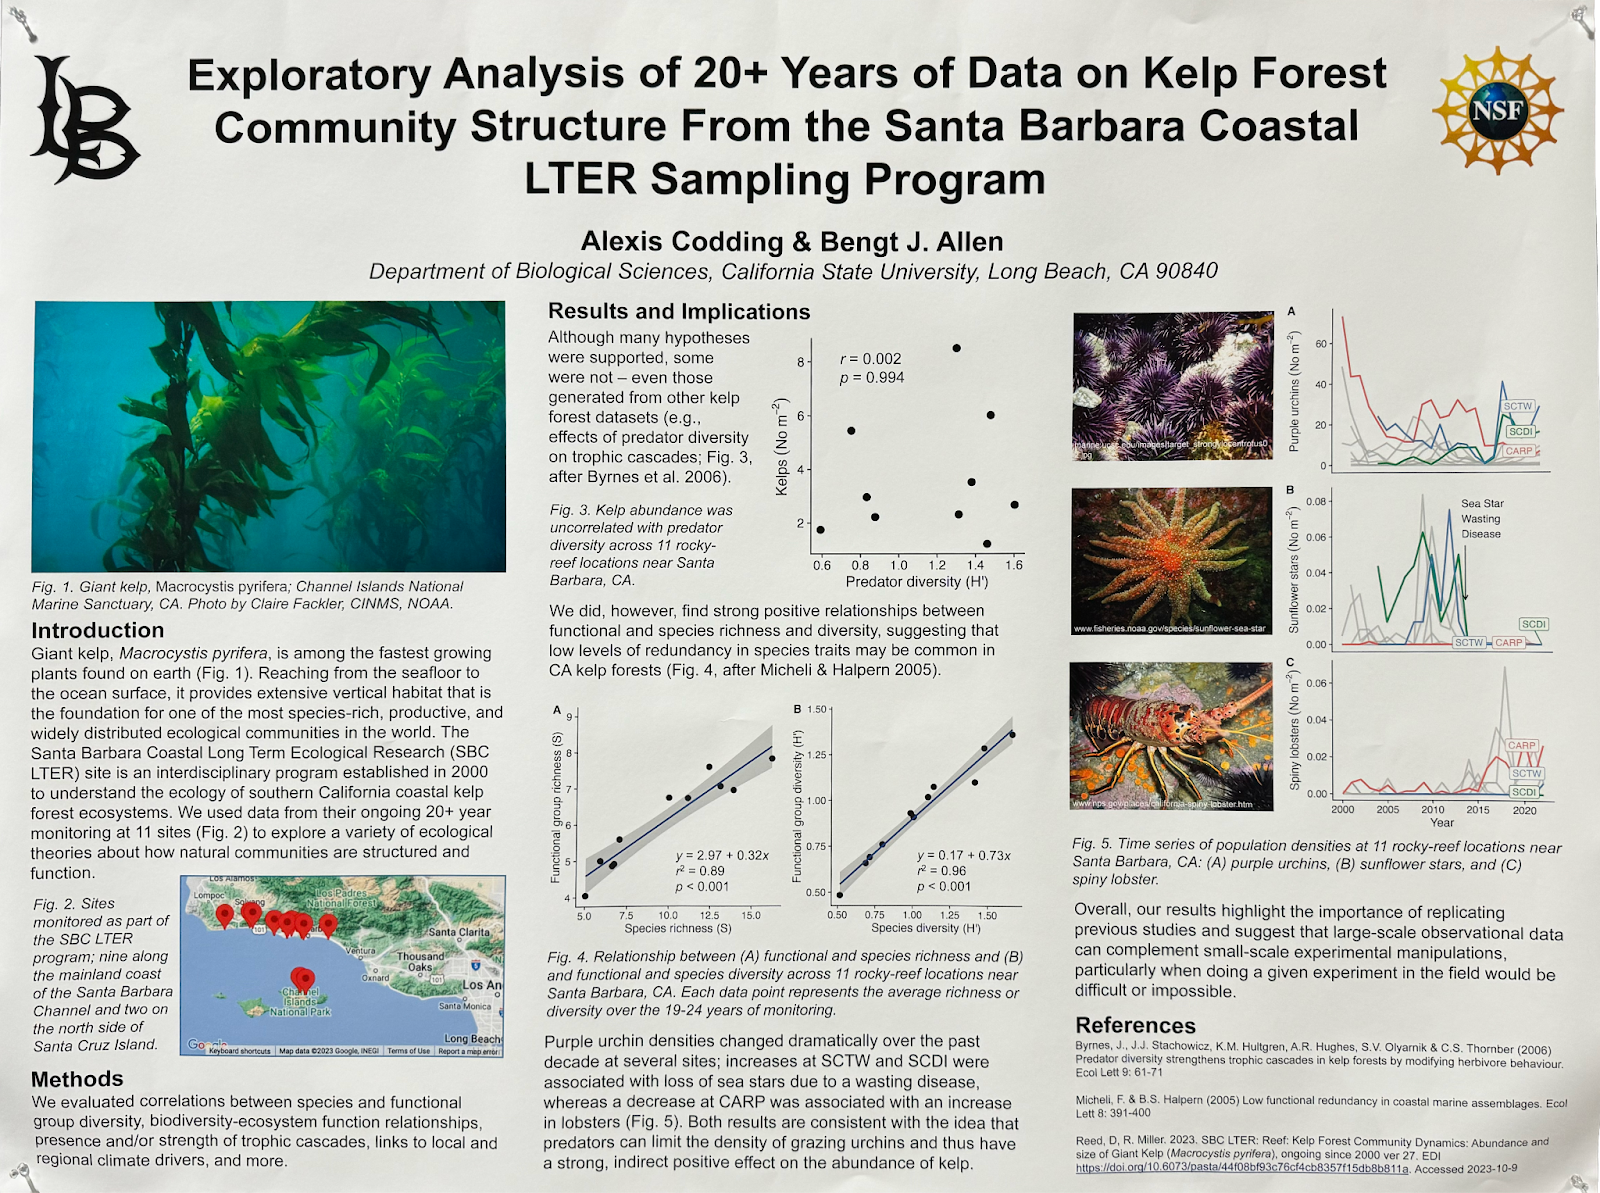
It was an innocuous seeming poster: “Exploratory Analysis of 20+ Years of Data on Kelp Forest Community Structure From the Santa Barbara Coastal Sampling Program,” one of many LTER projects represented that night in ESA’s poster hall.
I led with a softball question, something to break the ice. “So how did you get involved with the LTER?” I expected a standard response.
“Oh, we’re not!” was the reply.
That was not the standard response.
Looking for data?
How does an unaffiliated team wind up presenting a poster on decades of LTER data? It begins, as it so often does, with a need for data.
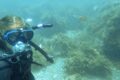
Just before starting graduate school, poster author Alexis Codding took a class with her future advisor, Dr. Bengt Allen, to learn about kelp forest ecology. They looked at data on kelp growth, learned about the tangled food chain and complex predator prey dynamics that regulate the algae’s abundance. They played around with tons of species level data, learning to code in R along the way.
Near the end of the course, Dr. Allen showed his students where he got all that data. “He has data up on the projector and it’s just everything you could want,” remembers Codding. “Buoy data, biogeochemical data, community data.” All of it was from the Santa Barbara Coastal LTER.
Dr. Allen had never worked at the LTER, but after a career working in coastal ecology, knew the project and many of the people involved. When he started exploring data to use in his course, the SBC LTER was an easy option: the data were free and available online; had consistent records of species abundance, oceanographic conditions, and more; and were very well documented, limiting much of the need for outside help.
The course’s final project involved an independent analysis of the SBC data, and Codding found those same traits incredibly valuable to her own work. “I really was able to find everything,” she says, noting that the metadata was so extensive that she never felt the need to reach out to folks at the site.
With a bit of additional work after the class, the analysis led to the poster at the ESA.
For us at the LTER Network Office, the poster was great confirmation that all the things we say about our data are, in many ways, actually true. It’s findable. Check. Accessible. Check. The metadata speaks for itself. Check. It’s rich enough to be used by itself. Check.
Credit: Alexis Codding, CC BY-SA 4.0.
Similar findings, decades apart
Codding’s poster explores a number of existing theories about how kelp forest communities are structured. She analyzed links between species richness and functional group diversity, as well as charted population numbers in response to different environmental conditions, among other things.
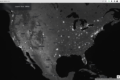
One result stood out, though: Codding found that predator diversity was uncorrelated with kelp forest abundance across the dataset. That result agrees with a 2005 paper coauthored by LTER executive director Ben Halpern, who found the same results in a global dataset.
The LTER has tons of similarly usable data across many ecosystems. You can find much of it at the Environmental Data Initiative website, who’s site includes a highly detailed search function.
Some LTER datasets have already been prepared specifically for teaching at the graduate level, and those can be found at the LTERDataSampler R package.
And of course, please let us know if you present a poster, write a paper, or give a talk using LTER data. We’d love to promote it!