EnzymeAssays-Haley-creditSedonaSpann
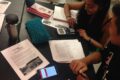
Haley Dunleavy conducting enzyme assays in the lab.
Haley Dunleavy conducting enzyme assays in the lab.
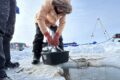
Emily Brooke, research technician on the project, sampling at the fertilization gradient experiment at ARC.
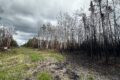
Dwarf birch and Labrador tea growing together at ARC.
Haley Dunleavy sampling ectomycorrhizal shrubs at the Arctic LTER.
Credit: Diana Magnusen
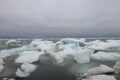
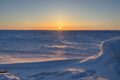
Figure 4. The Arctic is warming twice as fast as the rest of the planet.
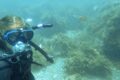
Figure 3. Soil waters had to be filtered in a oxygen-free glove bag back in the lab at Toolik Field Station to avoid oxidation of reduced iron before the start of experiments.
Researchers at Toolik Lake
Figure 1. Red-orange oxidized iron precipitates across the arctic landscapes.
Climate models of changes in ecosystem carbon and nitrogen with increases in temperature. Black, dotted line represents a model where vole effects are “Aggregated” with other biogeochemical processes. Red dashed line represents a model with constant vole density (100 voles per hectare). Blue solid line represents a model with a simulated “Vole cycle,” in which vole abundance fluctuates with peaks every 3-4 years based on demographic patterns observed in wild populations. When voles aren’t explicitly accounted for (aggregated, dotted black line), the model underestimates shifts in carbon and nitrogen stocks.