[vc_row][vc_column][vc_column_text]
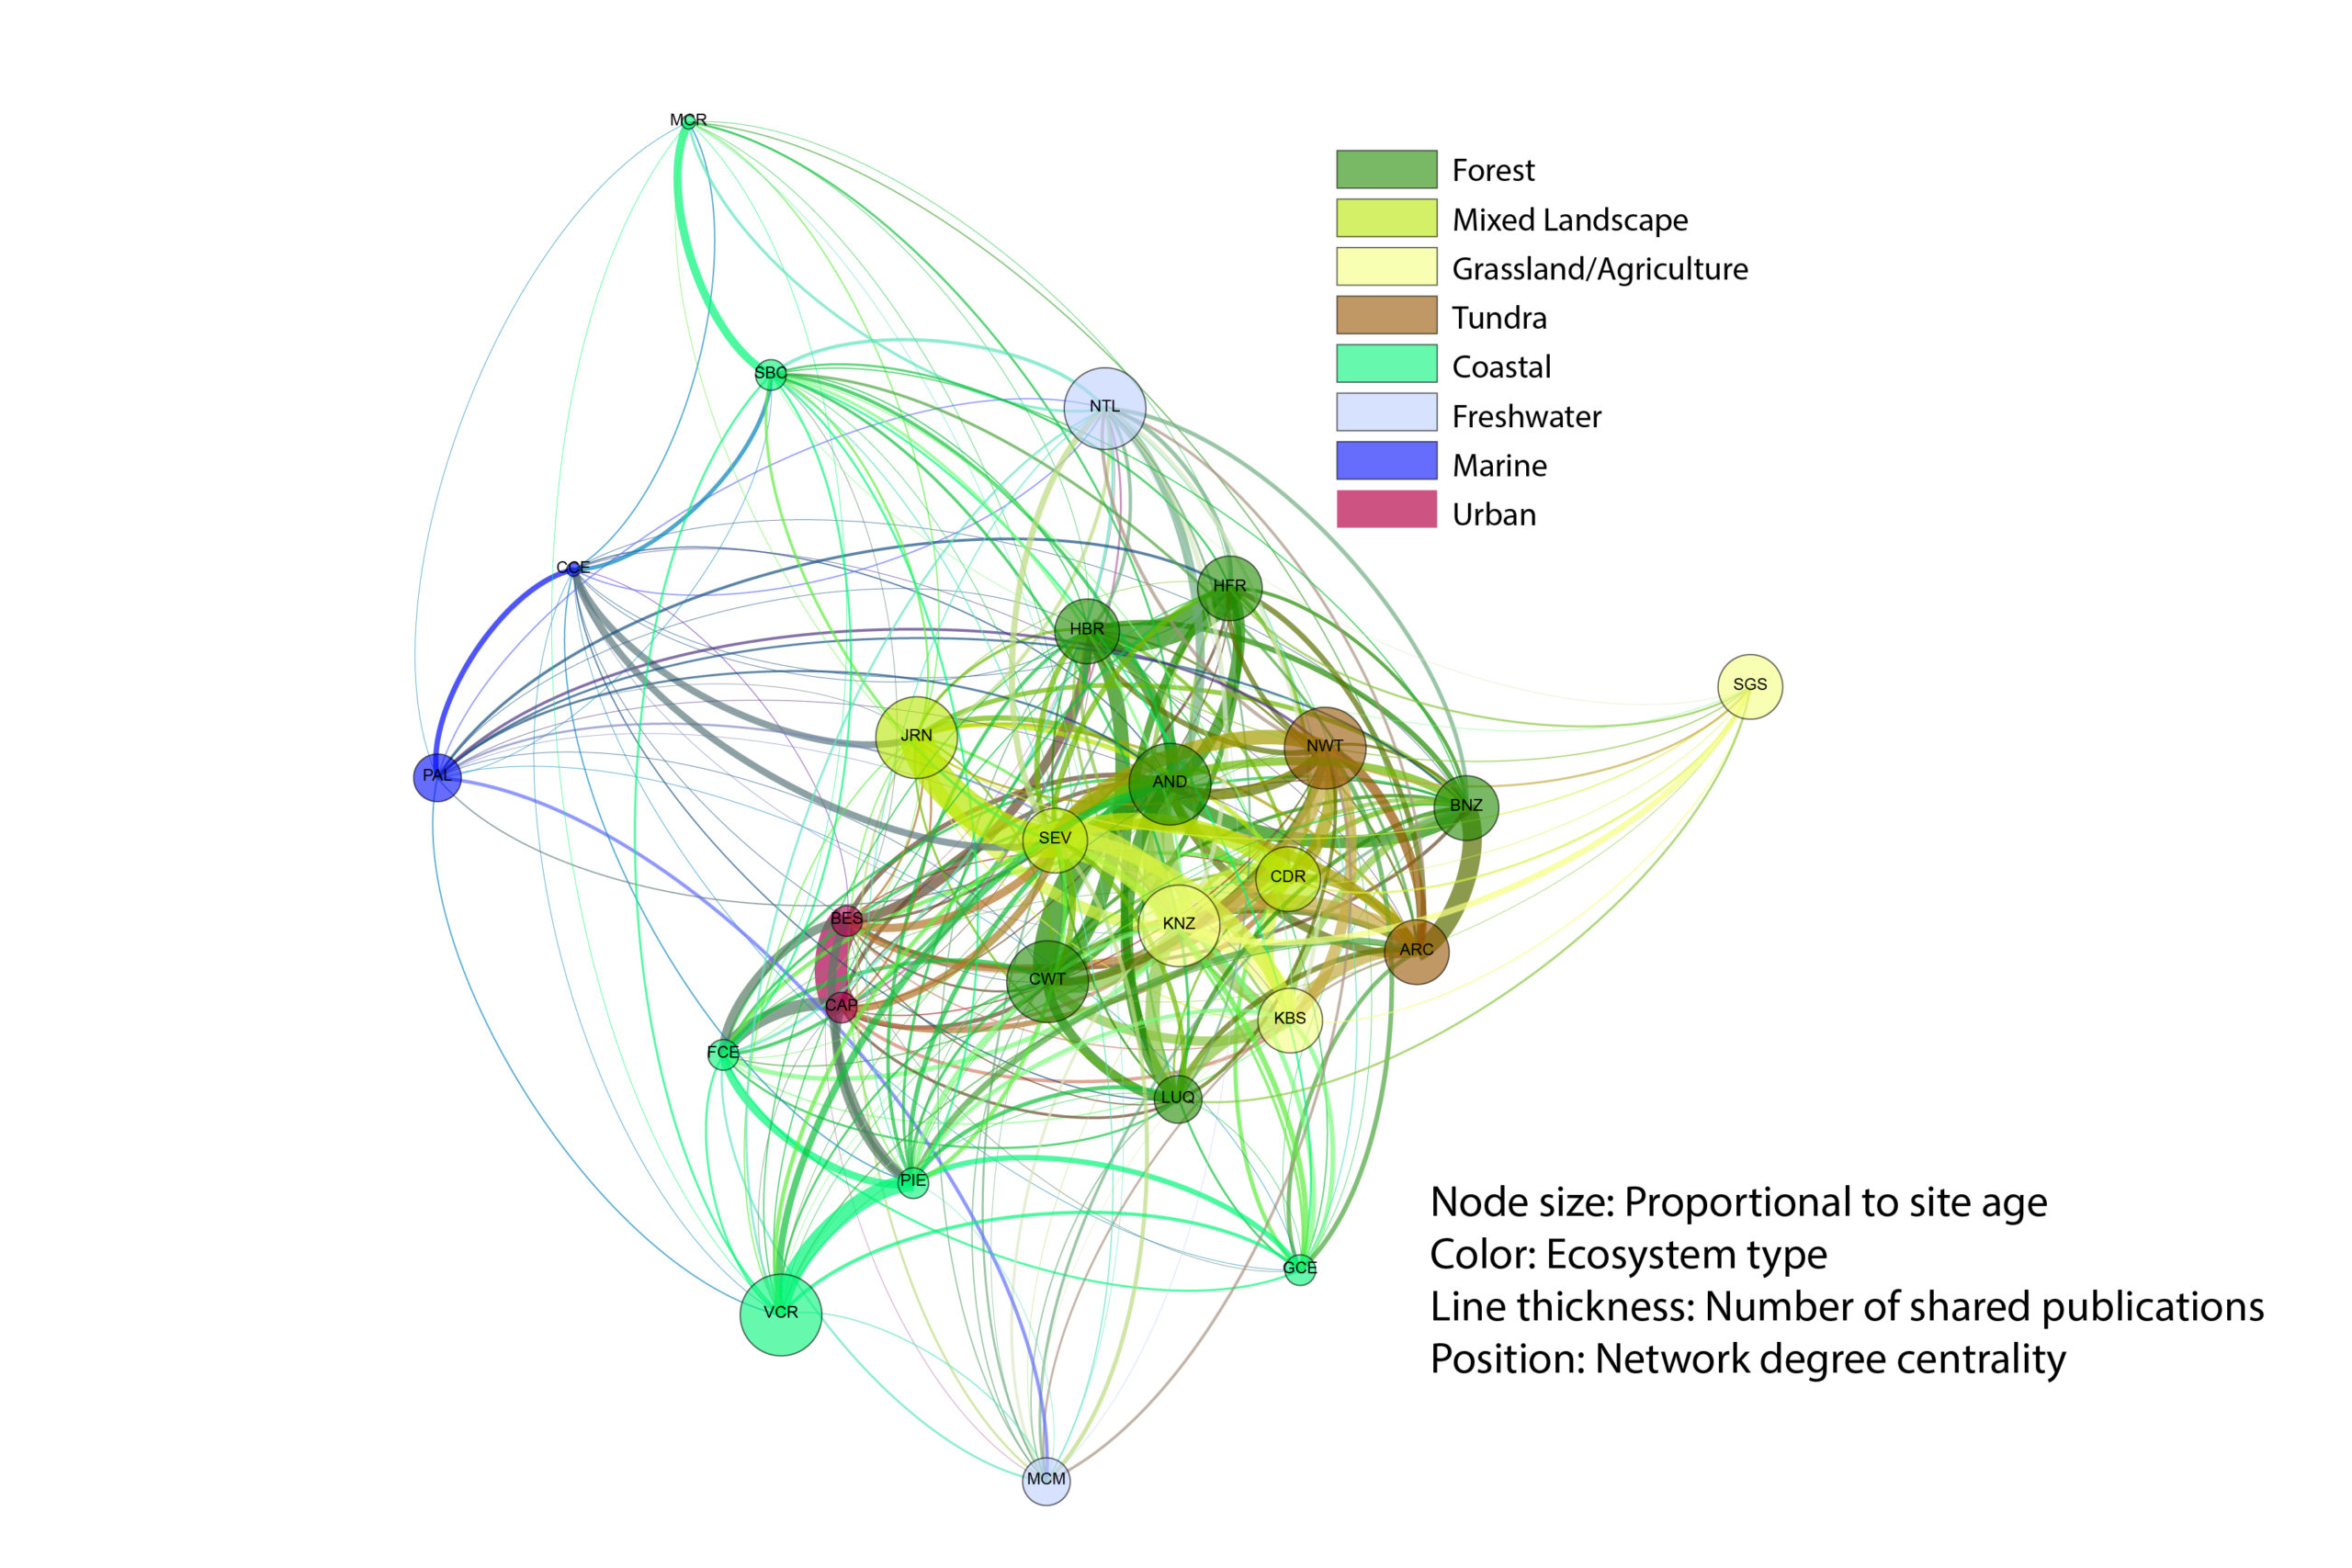
A network analysis of cross-site collaboration shows influence of ecosystem type and a cohort funding effect. Analysis is based on shared authorship from multiple sites among LTER papers published in the years 1980-2018 and visualized in Gephi.
Credit: LTER Network Office
Credit: LTER Network Office
In the first years of the LTER Network (1980-1990) collaboration was similar in the LTER Network and the field broadly. Collaboration everywhere increased steadily through the next three decades, but at a much faster rate for LTER-related papers. This outcome—LTERs as a magnet for collaboration—was expected and hoped for from the start of the network, but has never been so clearly demonstrated.[/vc_column_text][/vc_column][vc_column width=”1/3″][vc_single_image image=”82723″ img_size=”medium” add_caption=”yes” alignment=”center” onclick=”img_link_large” img_link_target=”_blank”][vc_single_image image=”82722″ img_size=”medium” add_caption=”yes” alignment=”center” onclick=”img_link_large” img_link_target=”_blank”][/vc_column][/vc_row][vc_row][vc_column width=”1/2″][vc_single_image image=”82725″ img_size=”medium” add_caption=”yes” alignment=”center” onclick=”img_link_large” img_link_target=”_blank”][/vc_column][vc_column width=”1/2″][vc_column_text]The authors also compared the duration of institutional collaborations in the baseline and LTER groups by counting the years in which two institutions shared authorships on papers. Collaborations lasting 3 or more years were 3 times as common in the LTER group as in the baseline group and those lasting 5 or more years were nearly 10 times as common as in the baseline group.[/vc_column_text][/vc_column][/vc_row][vc_row][vc_column width=”1/2″][vc_column_text]For distance, they compared the locations of the two most distant home institutions of authors on each paper. Long distance collaborations have been growing in frequency over the past 4 decades—due, presumably, to the internet and the growth of open data—but LTER collaborations lead the rest of the field by about a thousand kilometers in each of the last decades.[/vc_column_text][/vc_column][vc_column width=”1/2″][vc_single_image image=”82726″ img_size=”medium” add_caption=”yes” alignment=”right” onclick=”img_link_large” img_link_target=”_blank”][/vc_column][/vc_row][vc_row][vc_column][vc_column_text]The updated database also allows researchers to ask questions about which LTER sites collaborate most frequently with each other and what factors might lead to greater collaboration. A site funding cohort effect is apparent, that is: sites in similar ecosystems collaborate frequently, but the effect is even greater when they were funded at about the same time. Papers related to information management projects are co-authored by researchers at multiple sites, which suggests such projects enhance collaboration in two ways—through the projects themselves and by making LTER data more accessible and reusable.
Other potential drivers of collaboration, such as all scientists’ meetings, synthesis working groups, and cross-site career mobility, are more difficult to tease out from the general trend toward increasing collaboration. In a recent DataONE webinar, author Marty Downs discussed both the published network-level analysis and ongoing analyses of cross-site collaboration.
— by Marty Downs
Source: Huang, Tian-Yuan, MR Downs, J Ma, B Zhao, Collaboration across Time and Space in the LTER Network, BioScience, https://doi.org/10.1093/biosci/biaa014[/vc_column_text][/vc_column][/vc_row]