[vc_row][vc_column][vc_column_text]Data literacy is important for both students and educators as it is essential in the development of quantitative reasoning skills. Data Nuggets and Data Jams help students develop critical thinking skills as they explore authentic datasets derived from cutting edge science designed in partnership by teachers and scientists. By exploring actual data students also connect with the personal story of the researcher and the real life challenges that goes into scientific research.
Data Nuggets give students practice working with real world ecological data and interpreting quantitative information. Students are guided via a scaffolding model that follows the scientific process including identifying hypotheses and predictions, visualizing and interpreting data, making evidence based claims, and asking their own questions for future research.
Data Nuggets can be used throughout the school year, and across grades K-16, as students grow in their quantitative abilities and gain confidence. These Data Nuggets are derived from LTER research.
View all LTER Data Nuggets[/vc_column_text][/vc_column][/vc_row][vc_row][vc_column width=”1/2″][vc_column_text]
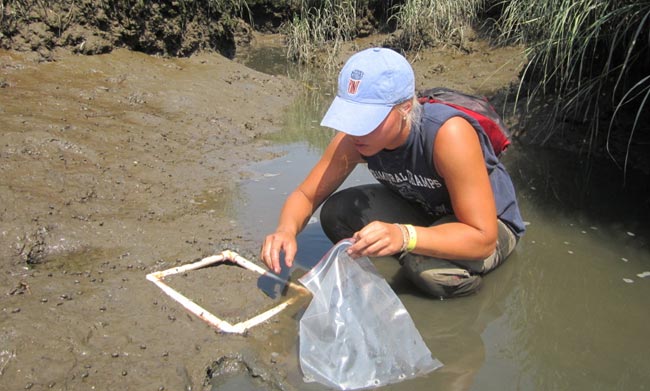
Make way for mummichogs

[/vc_column_text][/vc_column][vc_column width=”1/2″][vc_column_text]
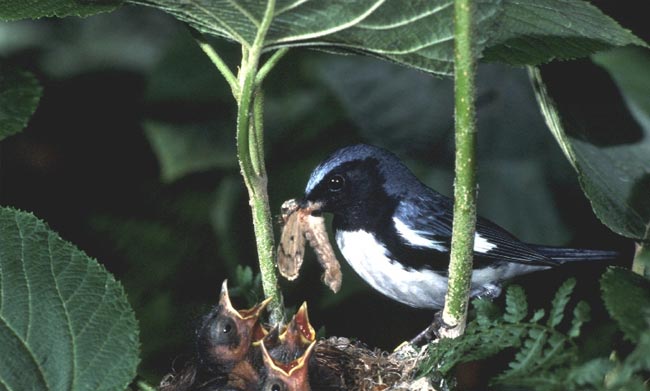
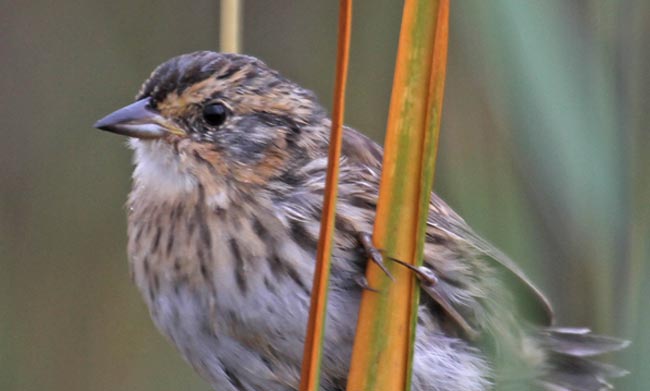
Bye bye birdie? Part I
[/vc_column_text][/vc_column][/vc_row][vc_row][vc_column width=”1/2″][vc_column_text]
Bye bye birdie? Part II

[/vc_column_text][/vc_column][vc_column width=”1/2″][vc_column_text]
Keeping up with the sea level

[/vc_column_text][/vc_column][/vc_row][vc_row][vc_column width=”1/2″][vc_column_text]
Urbanization and Estuary Eutrophication

[/vc_column_text][/vc_column][vc_column width=”1/2″][vc_column_text]
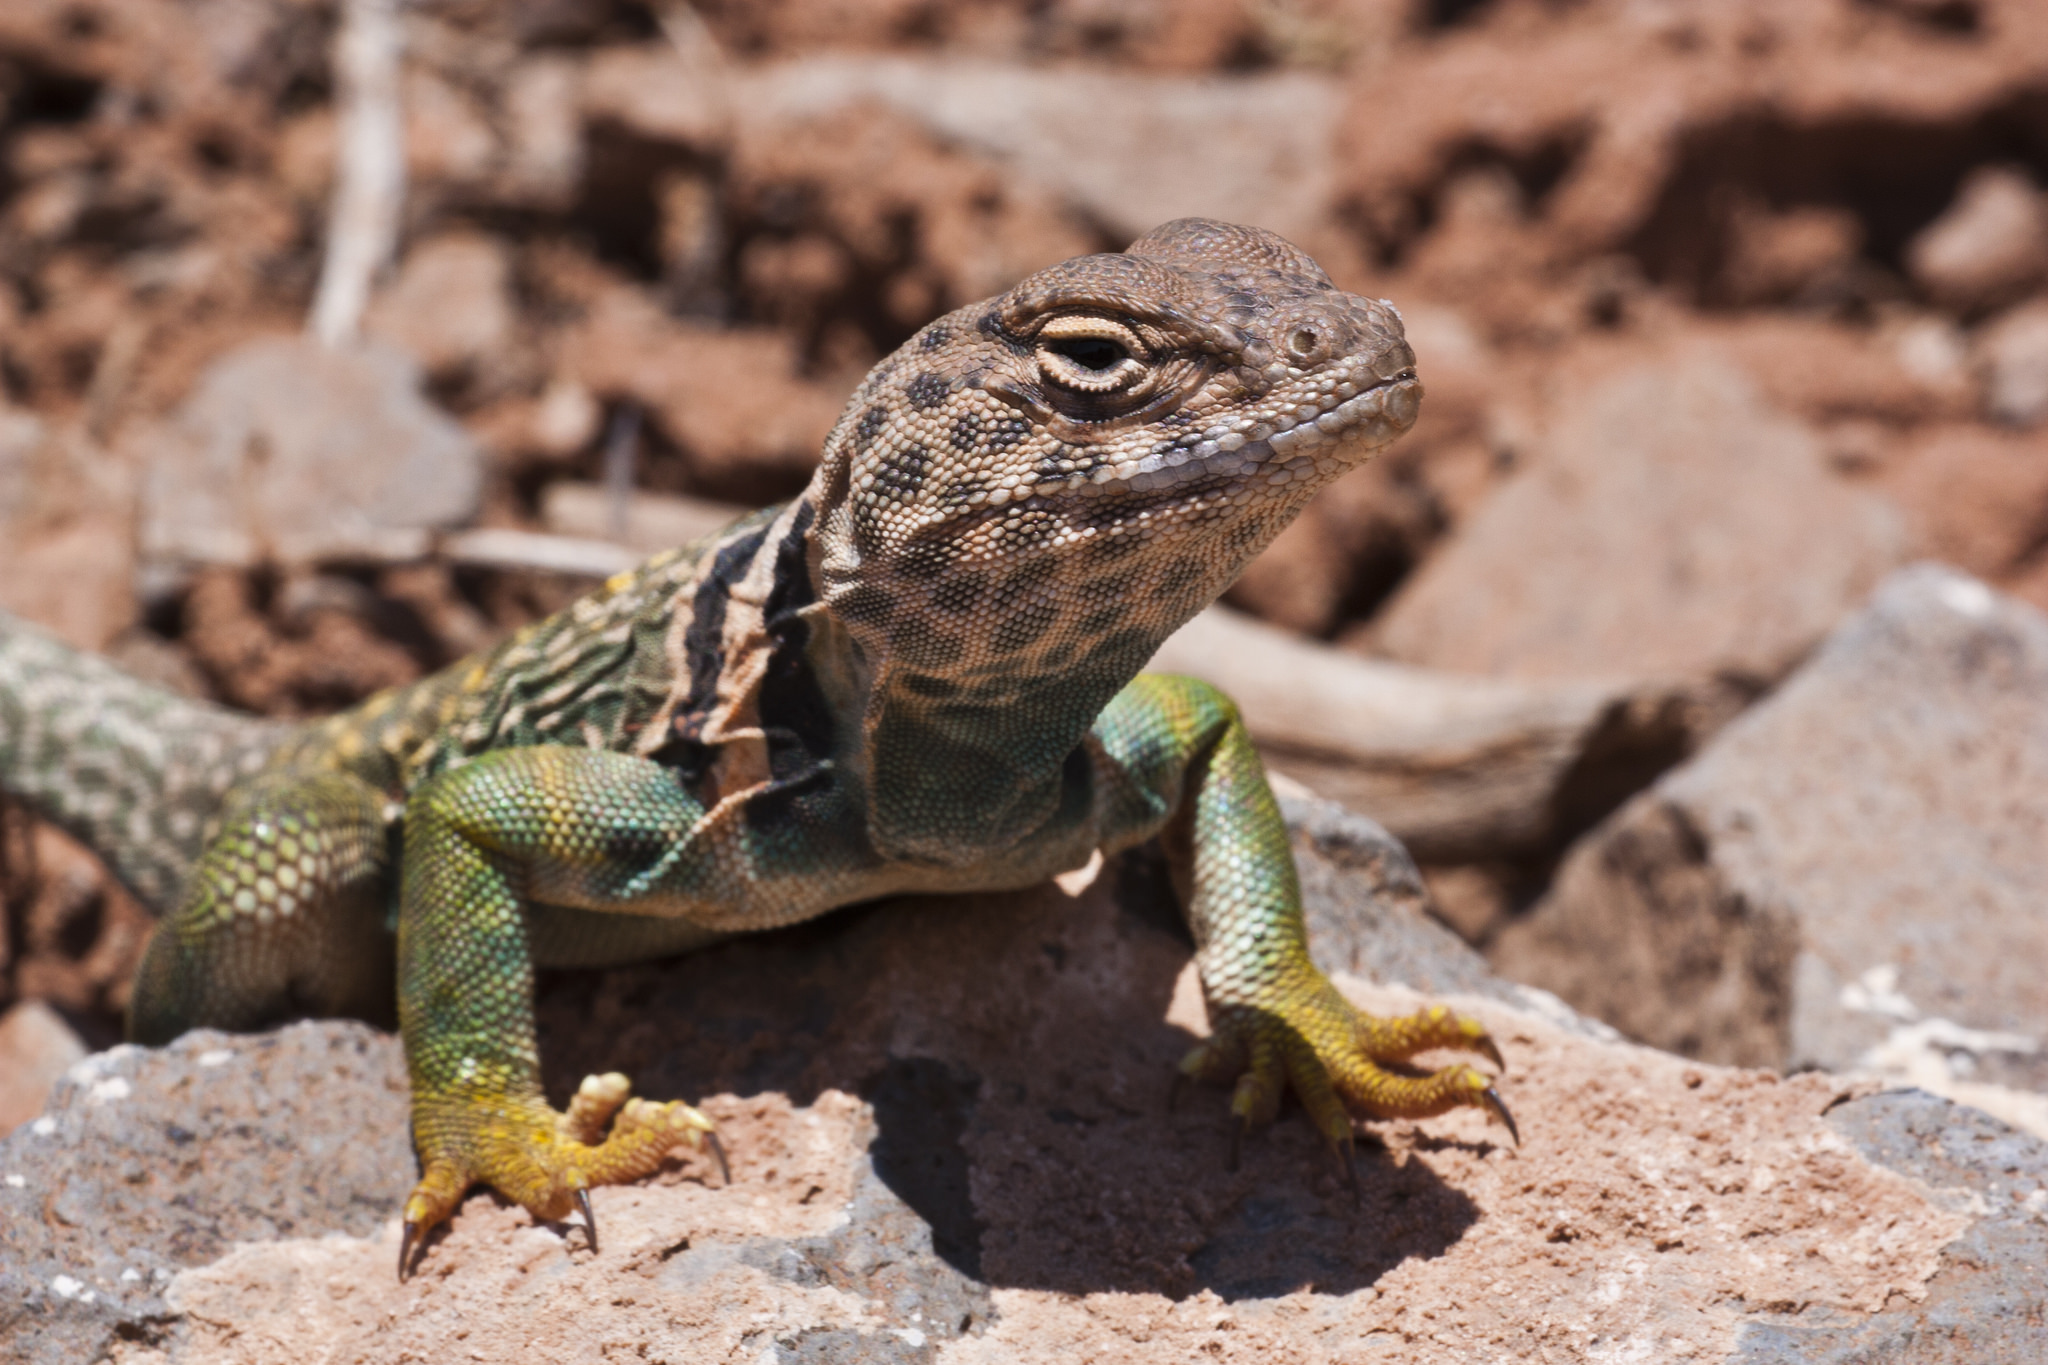
Lizards, Iguanas, and Snakes! Oh My!
[/vc_column_text][/vc_column][/vc_row][vc_row][vc_column width=”1/2″][vc_column_text]
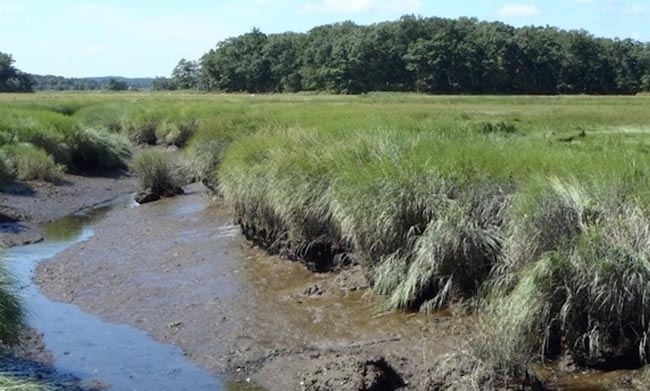
Is your salt marsh in the zone?

[/vc_column_text][/vc_column][vc_column width=”1/2″][vc_column_text]
Does sea level rise harm Saltmarsh Sparrows?
[/vc_column_text][/vc_column][/vc_row][vc_row][vc_column width=”1/2″][vc_column_text]
Urbanization and Estuary Eutrophication
[/vc_column_text][/vc_column][vc_column width=”1/2″][vc_column_text]
Can a salt marsh recover after restoration?
[/vc_column_text][/vc_column][/vc_row][vc_row][vc_column width=”1/2″][vc_column_text]
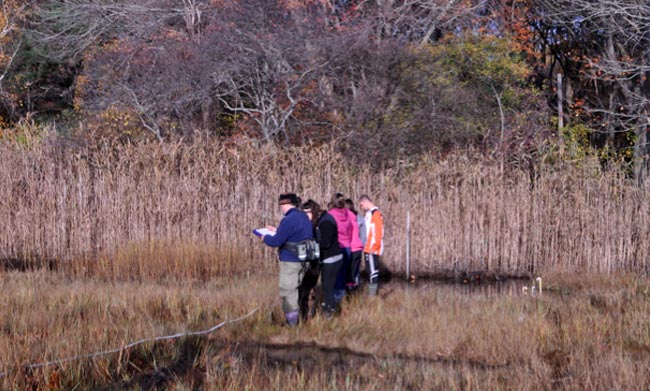
The mystery of Plum Island Marsh
[/vc_column_text][/vc_column][vc_column width=”1/2″][vc_column_text]
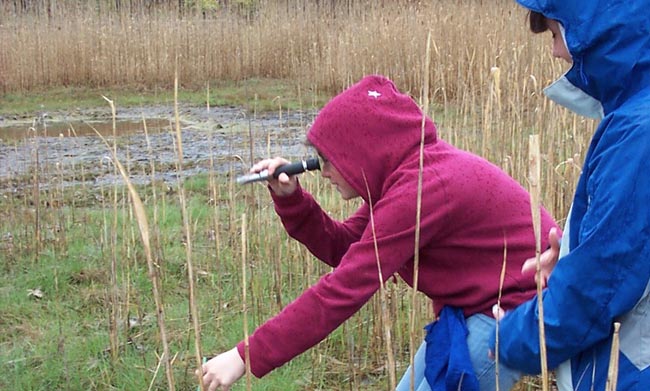
Invasive reeds in the salt marsh
[/vc_column_text][/vc_column][/vc_row][vc_row][vc_column width=”1/2″][vc_column_text]
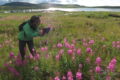
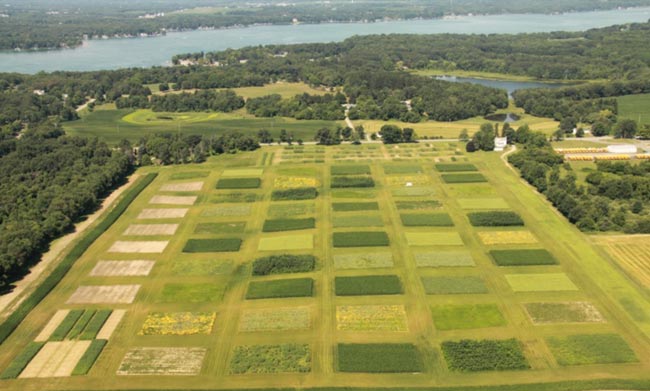
Growing energy: comparing biofuel crop biomass
[/vc_column_text][/vc_column][vc_column width=”1/2″][vc_column_text]
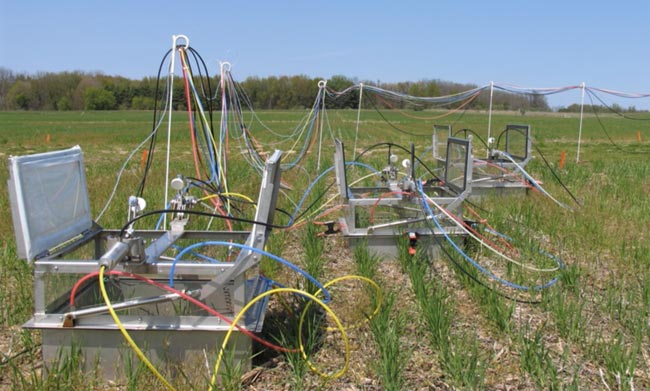
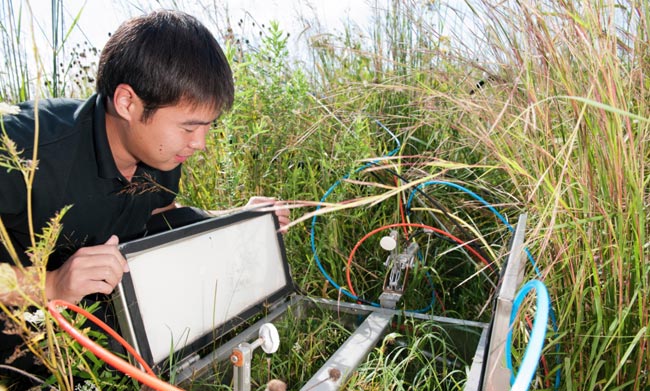
The ground has gas!
[/vc_column_text][/vc_column][/vc_row][vc_row][vc_column width=”1/2″][vc_column_text]
Fertilizing biofuels may cause release of greenhouse gasses
[/vc_column_text][/vc_column][/vc_row]