Sprinklers watering a plot in the Big Bio experimental area.
Credit: E Zambello/LTER-NCO CC BY 4.0
In my basic college ecology class, we spent an entire chapter discussing biodiversity. In the environmental field, there are a few bedrock principles we often take for granted: one, more diversity is good; two, biodiversity leads to more resilient ecosystems; and three, biodiversity should be a goal for land managers.
But how do we actually know these things? At the Cedar Creek Ecosystem Science Reserve LTER (CDR), a ‘Big Bio’ field site has provided scientists with decades of data on biodiversity.
Big Bio is aptly named, and I had to return to the site three times before I could even grasp the scope of the experiments undertaken here. There are 342 plots in all, with sub-experiments within each plot all located in a giant field surrounded by trees (on one side, the trees themselves are part of the plots). Birds sing everywhere, from Eastern Kingbirds and Eastern Bluebirds that sit on plot markers and sprinkler spigots to the large Sandhill Cranes soaring overhead.
“I know this is not the point,” I said to CDR-LTER Co-Leader Dr. Sarah Hobbie and Principal Investigator Dr. Forest Isbell when they introduced me to the plots, “But this is all so beautiful.”
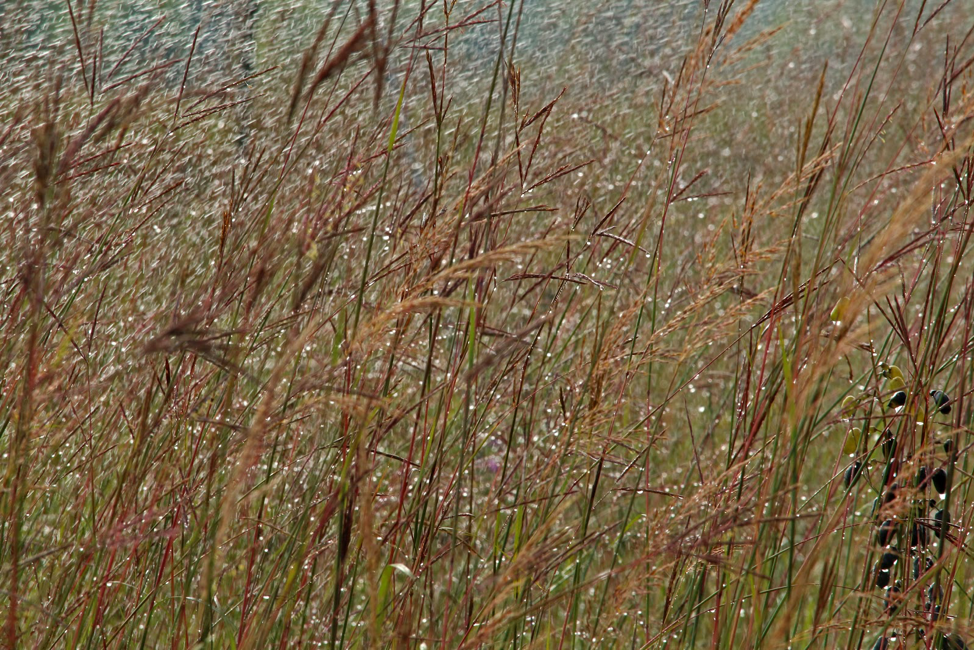
Each plot has a specified number of species present, from 0 up to 32. Big bluestem and little bluestem waved slightly in the breeze, while purple and yellow wildflowers seemed to glow at all hours of the day. In the most diverse plots, plants grew in vertical layers, their multi-structured environments contrasting visually with the less diverse areas nearby.
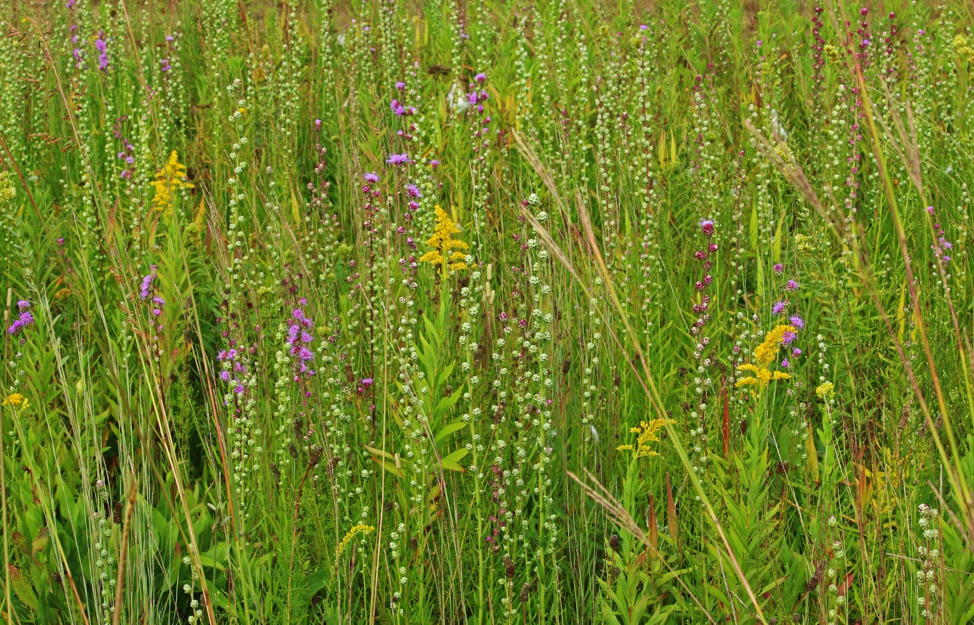
A diverse plot in Big Bio.
Credit: E Zambello/LTER-NCO CC BY 4.0
Biodiversity Findings
Big Bio began in 1994, and in 2001 scientists published a major finding: as their hypotheses suggested, the more plants contained in each plot (aka the higher the biodiversity) the more productive and stable that ecosystem remained. Moreover, the higher the biodiversity, the more biomass (total mass of living organisms) produced in each plot.
Building on initial research, scientists have also added drought, heat, and increased CO2 effects in the nearby BAC (biodiversity and climate) and BioCON (Biodiversity, CO2, and Nitrogen) experiments, testing how biodiversity responds to these additional factors.
Plots within Big Bio.
Credit: E Zambello/LTER-NCO CC BY 4.0
After a pilot project with tree diversity proved successful, CDR replicated the Big Bio design nearby with tree species, still young enough to look like a greenhouse nursery along the road. This new experiment, the Forests and Biodiversity (FAB) experiment, is projected to deliver results for decades and longer. An army of summer interns maintain the Big Bio plots with the correct number of species, constant weeding and mowing just part of their many duties. In the years to come, scientists will analyze whether the biodiversity patterns they observed in plant plots are comparable to trees.
Looking to the Future

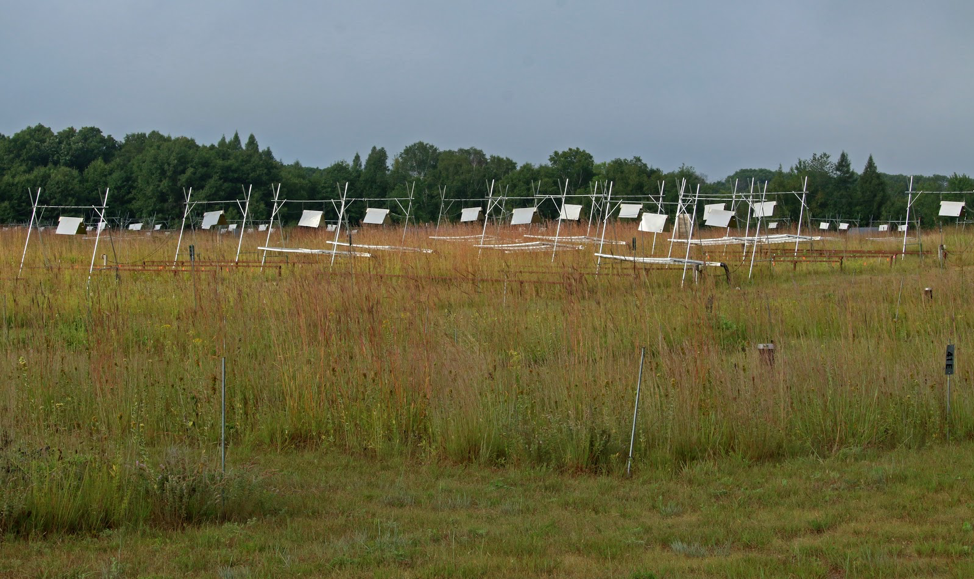
Drought plots on Big Bio.
Credit: E Zambello/LTER-NCO CC BY 4.0
As CO2 in the atmosphere increases and the climate continues to warm, many regions of the United States and the world will experience more intense droughts. The results of Big Bio, BAC, BioCON and FAB are critical predictors of how ecosystems could react, as well as how biodiversity might mitigate changes.
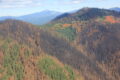
From above, Big Bio looks similar to a patchwork quilt, and like this historic craft, each square contains critical information necessary to understanding the whole. Instead of a multi-colored blanket pattern, each Big Bio plot creates a larger picture of the role biodiversity plays in our world.
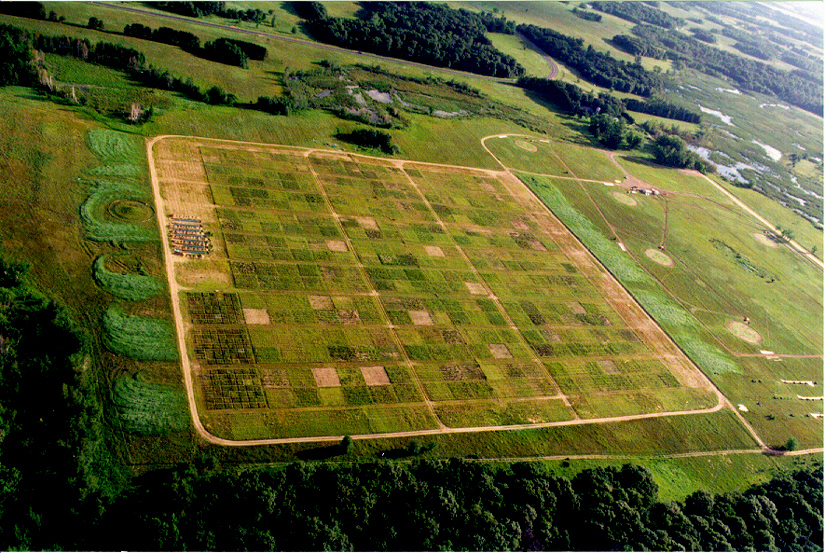
An aerial view of the Big Bio experimental plots.
Credit: CDR LTER