Exploring the Northern Temperate Forest at the Hubbard Brook Experimental Research Forest
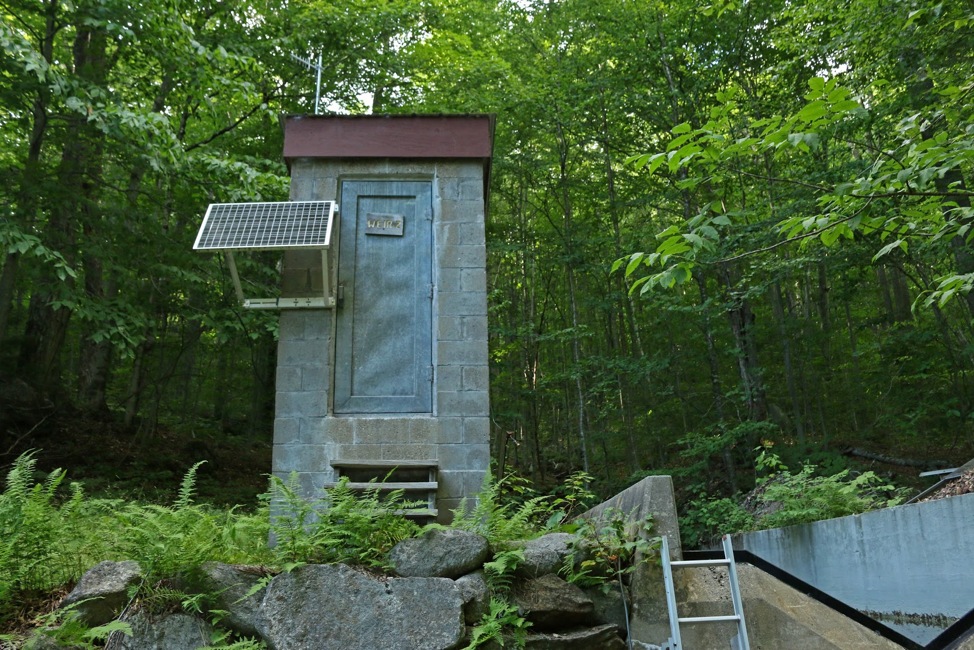
The Hubbard Brook weather station near headquarters.
Credit: E Zambello/LTER-NCO CC BY 4.0
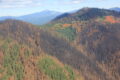
In 1955, the USDA Forest Service set aside over 3,000 acres in the White Mountains of New Hampshire for the express purpose of studying hydrology of northern temperate ecosystems, part of a novel, long term set of research initiatives known as the Hubbard Brook Experimental Forest. Today, researchers focus not only on hydrology, but wildlife, geology, and how people impact the environment.
I arrived on an absolutely gorgeous day in August. Blue skies were broken only by wispy clouds, and temperatures hovered in the mid-70’s; since I am currently living in sweltering Florida, it felt like heaven.
After introductions and a quick tour of headquarters, Dr. Lindsey Rustad, team leader at Hubbard Brook (who also happens to be my mother!) and I headed out into the watershed in a four-wheel drive SUV. Everything looked green. The canopy foliage overlapped in layers and layers, completely covering the sky. Lilies of the valley popped up from the previous year’s brown leaf litter, and witch-hobble spread in patches in the understory, their signature heart-shaped leaves bobbing in the forest breeze.
As we headed up in elevation, we noticed that all the streams, including the famous Hubbard Brook for which the experimental forest is named, flowed at very low levels. This summer season was dry, and even the perennial streams had nearly disappeared.
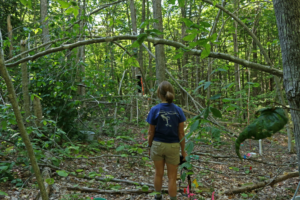
Dr. Lindsey Rustad stands in an ice storm plot.
Credit: E Zambello/LTER-NCO CC BY 4.0
Ice storm impacts, two years on
We stopped first at one of the ice storm plots. During January of 2016, researchers iced these areas to varying thicknesses, arcing the spray from fire hoses high into the winter night sky and letting it fall as freezing rain. Two seasons later I could definitely tell which plots had been iced. Those that had been treated with the thinnest covering of frozen precipitation looked similar to the northern temperate forest surrounding us. But when we reached the plots once laden with the most ice, tree trunks had snapped and bent, arching in half-moons over the ground. When we looked up, our faces met bright sun as the bent and broken trees had created a significant canopy gap. Our view to the sky was unobstructed.
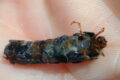
The forest floor was covered in various data collectors and their identifying flags—from litter bags to nitrogen rings and data loggers. A large, black, box-like contraption collected beetles for scientists comparing the populations between iced and un-iced areas. All the experiment plots are continuously digitally recording data for scientists to track the varying ice storm treatments over time.
Hopping back into the car, we continued to climb up and up, stopping briefly at one of the many rain gauges and weather stations throughout the Experimental Forest. The small field was covered in grass and ferns, an herbivore’s oasis.
Tracking a stream of data
Hubbard Brook is perhaps most famous for an important network of weirs throughout its watershed, continually amassing water quality and flow data on streams and creeks. Water collects in a cement, rectangular catchment area, then flows through a small notch at one end where it is measured before continuing its journey downstream.
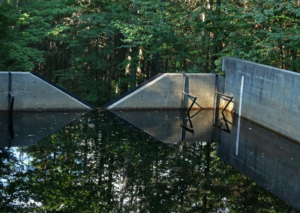
A weir reflects the trees above.
Credit: E Zambello/LTER-NCO CC BY 4.0
Weir 9 is at the highest elevation of any weir in Hubbard Brook, and like the others we saw, flow had been reduced to a mere trickle. The water in the catchment area sat so calmly that it provided the perfect reflection of the trees above. Dr. Rustad showed me the instruments inside the wooden weir building (which is about the size and shape of a standard outhouse); all now collect data automatically, reducing staff workload.
Equipment wasn’t the only thing to discover inside the weir. A mouse family had evidently decided to make a home in the warm, wooden shelter, and their shavings stacked up like a soft pyramid in the right-hand corner of the structure.
As we descended, we stopped at more weirs to take photographs. I always love how wildlife interacts with the data collectors. In addition to the mice, frogs loved the square pools, resting on leaves that floated upon the surface.
We made sure to visit Weir 6, which acts as the chemical reference catchment for all of the Hubbard Brook Watersheds. Weir 4 had just been rebuilt, and Weir 2 was surrounded by rock, sand, and rubble in preparation for a culvert replacement nearby. Equipment maintenance is a 365 day job!
The next morning, Dr. Rustad and I checked out some of the study plots near headquarters, starting with CCASE, or Climate Change Across Seasons Experiment. CCASE attempts to untangle the impacts of climate change on forest soils by physically warming the soil. In contrast to earlier soil-warming experiments, CCASE treatments continue through the winter.
The plots here really looked wired. Cables and PVC conduit slithered in and out of the ground and leaf litter, while colored flags “marked the spot” for plots and instruments alike. Data loggers had been hooked up to power boxes that also powered cables artificially warming the soil.
Nearby we walked to DroughtNet. Built in two separate areas, long, narrow, trough-like structures have been erected about eight feet above the ground to catch about half of the incoming precipitation, simulating a 100-year drought for this site. (It also catches a lot of leaf and tree litter!) The data collectors—now becoming familiar—had been strategically placed underneath the structures.
Introduction to the “dirty lab”
Dr. Rustad took me through the barn and into their “dirty” lab—named for the soil samples that are often dried there (as opposed to the “clean” hydro lab). Staff had carefully laid soil samples out on the lab table, with still more stacked on a metal shelf by the door.
Think dirt is just one, generic brown shade? Think again! Some samples appeared deep brown, others a light tan, while still others took on the reddish hue of rust: a rainbow of northern temperate forest soils.
I have never taken a soils class, and so had never marveled at all the colors and textures possible in just a small area. In fact, as the United States moves away from its agrarian roots, fewer and fewer people understand the intrinsic complexity of soils, sitting like a patchwork quilt across a varied landscape.
Weir 2 at Hubbard Brook.
Credit: E Zambello/LTER-NCO CC BY 4.0
Making a trove of data treasures easier to explore
Last stop: the archive building. It’s not very eye-catching from the outside, but inside data treasures have been amassed, from precipitation and stream samples to tree cores to soils to so much more. The archives literally hold thousands of samples dating back to the 1960’s, all neatly labeled and arranged. The samples are currently undergoing a technology upgrade. In the near future researchers will know the results of the tests and the papers published based on each and every sample, merely by scanning a barcode. That is a mouth-watering amount of data.
As it was the end of the summer, during the afternoon undergraduates presented results of their summer research at Hubbard Brook. These eleven students looked at a wide range of ecological phenomenon, from sonifying data, to soil respiration, to the array of insects that can be found within the experimental forest. For them, Hubbard Brook truly was a living laboratory, and they returned to their studies with in-depth knowledge of the ecosystems as well as the field work methods practiced here.
Ending my visit with student presentations was perfect. They are the future of Hubbard Brook and the research directions this facility could take in the coming century; simultaneously, they have decades of archived data on which to base their new discoveries.