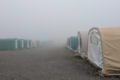
photoCombo3
(left) Paint markings left by attendees to the art symposium. (right) The finished result from Abigail, depicting a polar bear being held up by human hands.
(left) Paint markings left by attendees to the art symposium. (right) The finished result from Abigail, depicting a polar bear being held up by human hands.
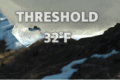
Painting of deep ocean temperature anomaly in the West Antarctic Peninsula (1993 – 2020), where the x-axis is time and the y-axis is temperature, with realistic and contoured Gentoo Penguin chicks superimposed.
A combination of penguins, whales, and sea ice data. The layered paper represents the seasonal growth and decay of sea ice extent in the West Antarctic Peninsula from the 1970’s to the 2020’s. The left side of each layer is the start of the season (fall) and the right side of each layer is the end of the season (spring) and a single layer is one year’s data with the oldest (1979) at the top. This diagram shows the severe decline of the sea ice season length and extent, upon which the local penguins rely for a habitat.
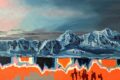
Painting that combines a photograph of the mountains seen while transiting the Gerlache Strait, with a contour plot of oceanic temperature derived from a profiling robot deployed in the region. The dimensions of the contour plot are depth (y-axis) and time (x-axis) and the color is in-situ temperature (warm colors are warm, dark colors are cold), so what we are seeing is several years of the upper ocean’s seasonal cycle.
Adelie penguins on an iceberg off the coast of Adelaide Island.
(left) Photo of the Laurence M. Gould in a field of small icebergs with the Antarctic continent in the background. (right) Painting of the same scene held by Abigail Willis.
PIE_LTER_2025_PhDPosition Plum Island Ecosystems LTER grad student 2025
A soil nematode, as seen under the microscope
Rachel presenting to visiting agricultural stakeholders
Rachel meeting with a farmer collaborator in front of a prairie strip