Slip-sliding through the decades
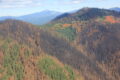
A view of Transect #327 on a steep hillside in Coweeta Forest.
Credit: E Zambello/LTER-NCO CC BY 4.0
I paused at the top of Coweeta Hydrologic Lab’s transect #327, peering down, down, down at the slope beneath me. Katie Bower, a research technician at Coweeta, and two summer interns had already started down the narrow pathway, accustomed to its slippery leaf layer and sharp contours. Taking a deep breath, I followed slowly behind.
The vegetation was fully leafed out, July just about ready to pass into August. Though big rain droplets fell from clouds overhead, the canopy was so dense that barely any precipitation made it through, leaving us relatively dry.
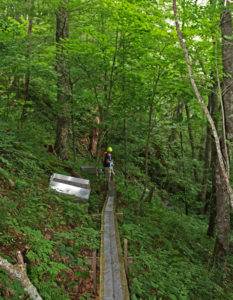
We descended, passing litter baskets and eventually hopping onto a single wooden board that stretched horizontally across the mountainside. As we paused to talk, I realized that scientists and students have been climbing this transect almost as long as I’d been alive.
“These plots were established in the early 1990’s, and we’ve been continuing on with the measurements since then,” Bower says.
Data, data, everywhere
Bower points to a smattering of plastic laundry baskets on the ground. “This is one of Jim Clarke’s plots (a scientist from Duke University),” she says. “Basically we’re looking at these litter baskets, we’re looking at leaf fall, we’re looking at the seeds. We’re seeing what’s reproducing,”
That’s not all. They’re measuring tree diameter, tree growth, and classifying trees based on where they appear in the canopy. Indicators of their ongoing studies are everywhere, from individual tree tags to orange plastic mesh drawing attention to downed wood on the forest floor.
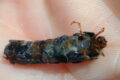
“We have to go out into this plot and count every piece of coarse woody debris, such as the one that I am standing on,” one of the interns explains. “We have to measure them in three different places for diameter, we have to measure their overall length, we have to tag them and write them down, and then we also had to rate them on a scale of 1-5 on levels of decay.” Researchers will monitor rates of decay, comparing the speed between different parts of the watershed.
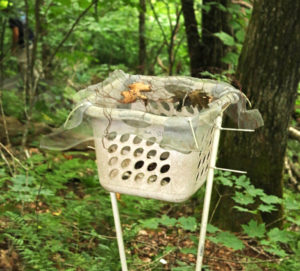
Leaf litter basket at transect #327, used to measure rates of leaf fall.
Credit: E Zambello/LTER-NCO CC BY 4.0
Their measurements and analyses contribute to an overall picture of how processes interact in one of the most biodiverse regions in the country, from water quality and quantity, to biodiversity, climate and land-use change. By continuing to collect information for long-term datasets, scientists can compare current snapshots of the transects with those from from decades ago.
Complexity yields diversity
When I asked Dr. Rhett Jackson, the lead PI for Coweeta, what is unique about this region he replied, “The cool thing about the Southern Appalachians is that we have really high endemism and species diversity of all sorts of things, from trees to fish to salamanders.”
He says that because the site has high complexity in habitat in terms of slope, slope position, moisture. We have huge precipitation gradients across the study area, and as a result there’s a diverse mosaic of habitats.
Coweeta LTER scientists study the dynamics of these diverse ecosystems over decades–working to answer questions such as how so many species can coexist, how a changing climate may affect water quality, and how forest management practices might change water supplies, carbon storage, or the spread of invasive species.
As I climbed my way out from transect 327 with Katie and her team (yes, I was breathing heavily at the end), I marveled once again at the dedication of these researchers to documenting ecological change. Neither rain nor slope nor mud will keep them from collecting data!