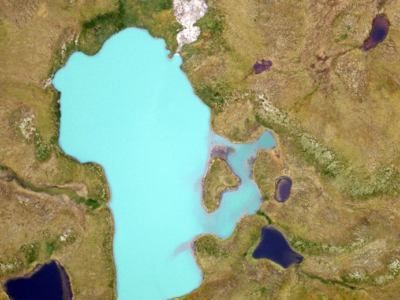
Indirect Indicators of Rapid Warming in the Arctic
Transport and Transformation of Carbon in Aquatic Systems
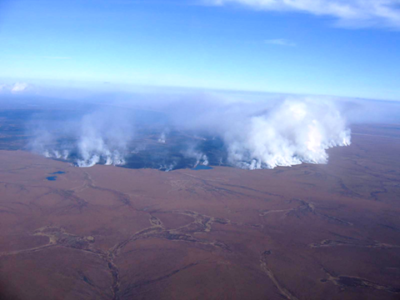
Wildfire and thermokarst: impacts and recovery
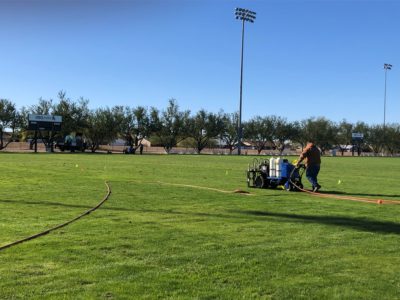
Determining Optimal Irrigation Regimes for Residential Landscapes
Effects of the 2008 Great Recession on Residential Landscapes
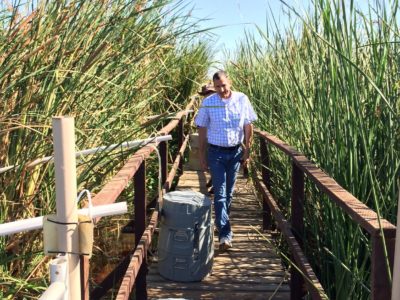
Plant Mediated Control of Surface Hydrology in a Constructed Wetland
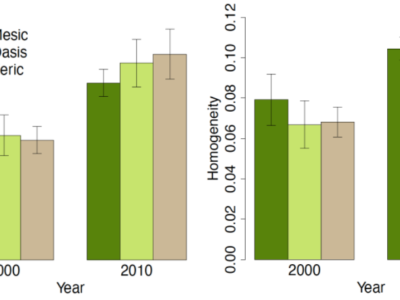
Urbanization Patterns and their Impacts on Biotic Diversity
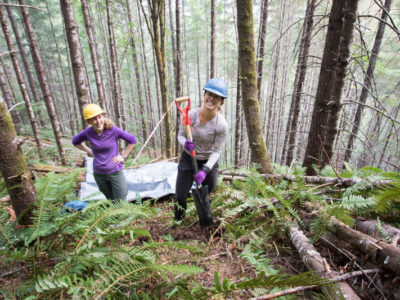
Disturbance Produces Multi-Decadal Legacies
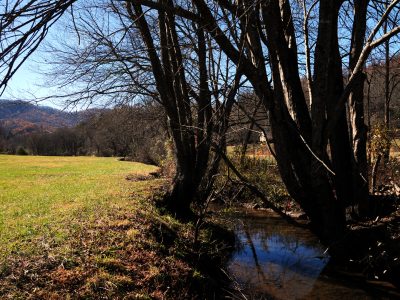
Scaling Up to the Catchment
Forest Biodiversity
Future Nitrogen Cycling
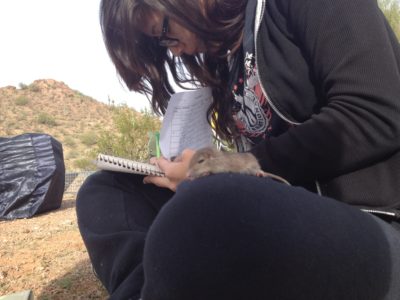
Climate Change and Habitat
Clean Water and Land Markets
Predicting Regional Climate
Controlling Plant Invaders

Importance of Household Decisions
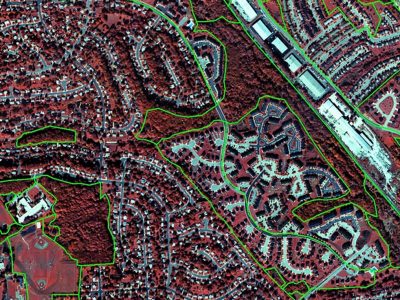
Mapping Urban Lands
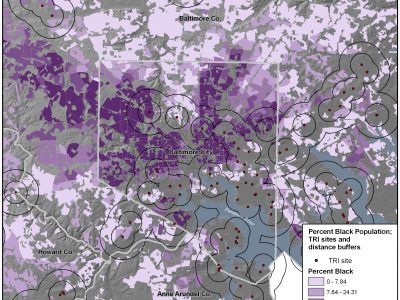
Perceptions of Justice
Top Stories
LTER at ESA, 2026
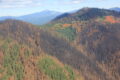
Studying post-fire Snowpack at the H.J. Andrews Experimental Forest

2026 Site Exchanges Announced
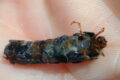
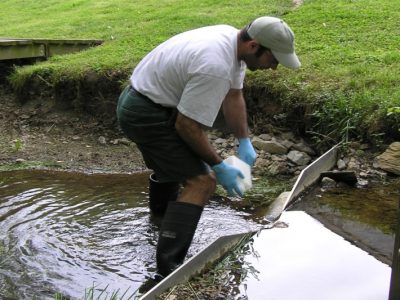
The caddisfly stole my heart

Shirah Strock | Virginia Coast Reserve LTER to Santa Barbara Coastal LTER

Vivian (Lin) Hou | California Current LTER to Northeast Shelf LTER

Dr. Nicholas Medina | Morton Arboretum to Minneapolis-St. Paul LTER

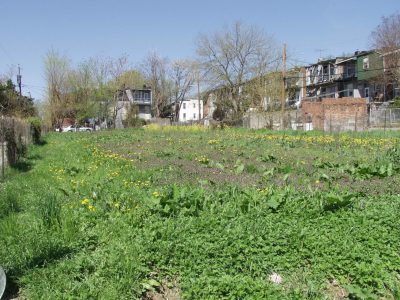
Brittany Washington | Baltimore Ecosystem Study to Two Urban LTERs

Melissa Frost | Kellogg LTER to Konza LTER

Cameron Clay | Minneapolis-St. Paul LTER to Luquillo LTER