There are a ton of repositories full of environmental data of all flavors. It can take a teacher a really long time to locate, download, explore, curate, test, and make a lesson with them from scratch.
 There are a ton of repositories full of environmental data of all flavors. It can take a teacher a really long time to locate, download, explore, curate, test, and make a lesson with them from scratch.
By Allison Horst and Julien Brun
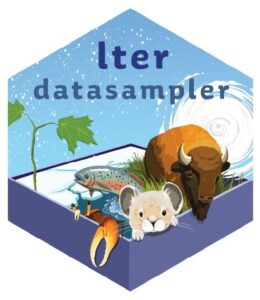
Today we are excited to share with the broader R community a new collection of 8 data samples geared towards teaching environmental data science—and beyond!
Finding the right data
We both teach environmental data science – which means that we help students and researchers gain skills to investigate environmental challenges and questions using environmental data. For our courses and workshops, we are always on the hunt for modern, approachable environmental datasets to use in our materials. Which can be surprisingly a time- and energy-intensive quest!
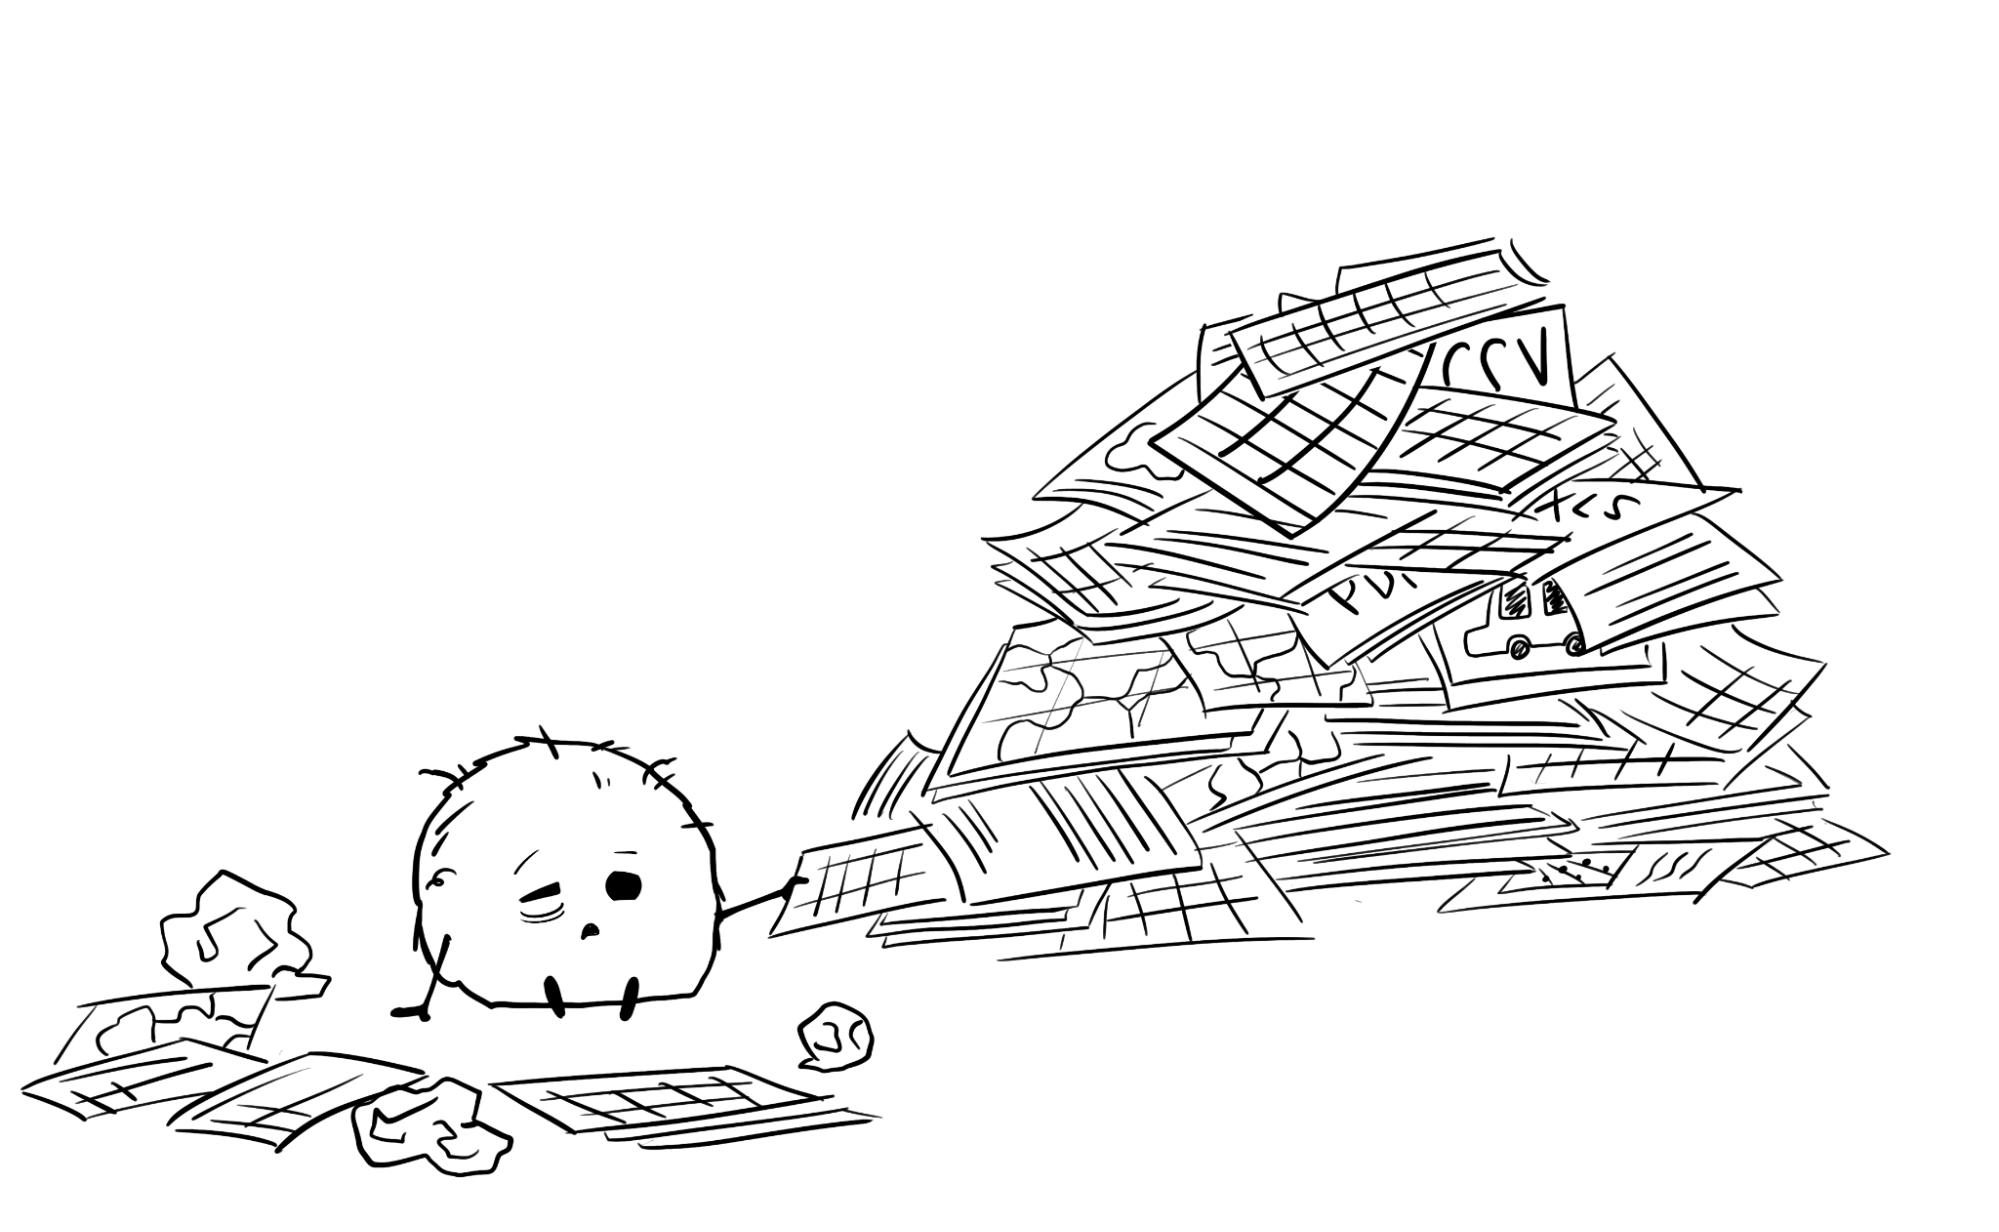
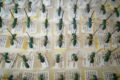
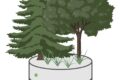
Curating datasets can be a long and lonely task
Credit: Illustration by Allison Horst
The issue with finding datasets for our teaching isn’t a lack of openly available environmental data – there are a ton of repositories full of environmental data of all flavors. It can take a teacher a really long time to locate, download, explore, curate, test, and make a lesson with them from scratch. Given how burdensome it can be for environmental science teachers to find and prepare datasets for data science and statistics courses, we thought it would be really useful for environmental data science instructors to have access to an openly available collection of curated datasets. Our goal was to make these learner-friendly, real-world environmental data that can help students consider environmental questions and learn data science and stats skills at the same time.
And we already have some evidence that there would be demand for this type of educational resource. Recently Allison and her co-authors Dr. Alison Hill (IBM) and Dr. Kristen Gorman (University of Alaska Fairbanks) developed and published the palmerpenguins R package. The package contains a dataset called penguins, which includes size measurements (like flipper length, body mass, and bill dimensions) for 344 penguins observed by Kristen and her colleagues on islands in the Palmer Archipelago, Antarctica. Since being published on CRAN in July 2020, the palmerpenguins package has been downloaded over 404,000 times, was almost immediately recreated as Python and Julia packages and added to Google’s TensorFlow datasets, and penguins is now widely used as an example dataset in teaching materials around the world. The message from penguins’ quick and widespread adoption was clear: data science instructors crave modern, approachable and easily accessible datasets. So we asked: if this one dataset is so useful for instructors, can we expand on it to provide a larger, more varied, and more versatile collection of environmental datasets with undergraduate and graduate educators in mind?
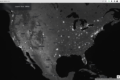
Enter the LTER network data
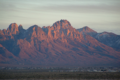
We already knew a good place to start looking for more datasets. The penguins data is from the Palmer LTER site in Antarctica, a site that is part of a network of 28 sites that comprise the US Long Term Ecological Research Network, or LTER. The LTER Network was founded by the US National Science Foundation (NSF) in 1980, and over the past 40 years has collected and shared over 7,000 datasets covering vastly different ecosystems, spatial and temporal scales, and topics from marine biogeochemistry to urban heat islands to… penguin sizes!
In addition to collecting, studying, and sharing both observational and experimental data to understand long-term ecological processes, the LTER Network’s mission also includes education, outreach, and the goal of “creating well-designed and well-documented databases.” The LTER is an amazing treasure trove of well-documented, openly available environmental datasets that we knew would be an ideal resource for this project.
What do you get?
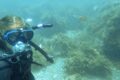
At this point there are 8 data samples in the LTER datasampler ranging from bison growth to hurricane impacts on stream chemistry. Each data sample has a code example to inspire instructors on how to best use the various materials to build their curriculum. Leveraging the cyberinfrastructures and community best practices to document and share LTER data, we also provide the code to download the full scientific dataset for those inspired to explore further. To promote scientific reproducibility, this code also contains all the data wrangling operations we used to go from the original data set to the data sample provided in the R package. Our final goal is to highlight one dataset for each of the 28 LTER sites. We’re still processing many of these, so stay tuned. In the meantime, we would love to hear your feedback!
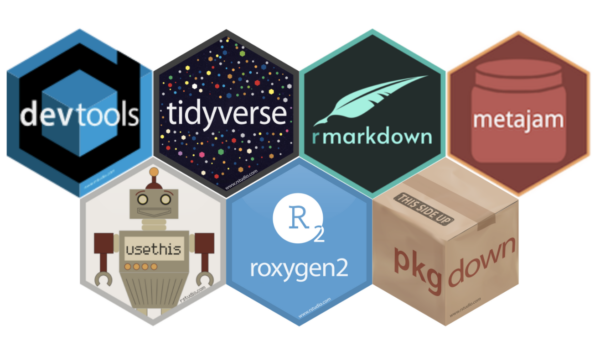
We’d like to thank all the people and groups supporting this project. In particular we’d like to thank folks from the LTER Network Office including Marty Downs, all the site information managers and the LTER education committee for sharing ideas and feedback with us on this project. A huge thank you goes out to the 5 UCSB undergraduate students (Adithya, Karen, Lia, Sam and Sophia) for their hard work on this project, and to their capstone advisor Dr. Sang-Yun Oh. And also to the developers, maintainers, and contributors of R packages that made this project possible.