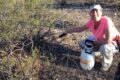
Dr. Bennett Lambert working with the FlowCytobot.
Credit: Sean Whalen / WHOI
The cyanobacterium Synechococcus is less than 2 micrometers in size, but accounts for twenty percent of coastal primary production. Using automated optical analysis, a group of LTER researchers at the Martha’s Vineyard Coastal Observatory (MVCO) have compiled an impressive 16-year record of hourly observations for the picocyanobacterium, revealing a regular seasonal pattern of cell abundance and growth as well as intriguing daily variation. Determining the variation in cell growth and division requires knowledge of daily dynamics. The time series revealed changes in seasonal abundance of Synechococcus with strikingly repeatable patterns caused by different drivers of cell division and abundance such as temperature, light, and predation.
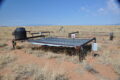
The team used an automated flow cytometer, FlowCytobot (FCB), bolted to the beam of the tower at MVCO for an average of 6 months at a time to analyse large numbers of samples and search for Synechococcus cells. Sixteen years of data uncovered major changes in abundance throughout each year across seasons. The team at MVCO labeled the four seasons on Syn as: Spring Bloom, Summer Cycle, Fall Fade, and Winter Wane. Synechococcus are a temperate species, so temperature and light are believed to be the main factors determining population growth, although the influence of these drivers of population growth that are not the same over the annual cycle. Spring and winter are temperature limited, while fall becomes more light-limited. During the Spring Bloom between April and June, cell concentrations increase by 2-3 orders of magnitude. The main driver of cell loss across all seasons is predation — so high abundances lead to higher losses.
Time series are an important tool when it comes to learning about the factors that determine abundance. This 16-year set of observations clearly expresses how decadal oscillations might affect planktonic species.
“Time series really are a team effort and a labor of love, and it’s been really exciting to see when patterns keep following the cycle,” says Dr. Kristen Hunter-Cervera, lead author and Hibbitt Early Career Fellow at the Marine Biological Laboratory in Woods Hole, MA. “We really can start to understand coastal dynamics and the variability in time scales.”
Each additional year of data adds to a baseline of key information. Some years that may seem like anomalies in shorter term studies may actually reveal themselves to be part of a normal oceanic process over a longer cycle. The research team at MVCO have created a strong reproducible model for future study of marine phytoplankton division rates. This is critical for understanding how environmental factors control cell growth and changes in concentration.
The next step for the MVCO research team will be to focus on testing hypotheses generated by the time series in the lab with cultured isolates. Carbon fixation by Synechococcus is well understood, but how carbon is transferred throughout the coastal food web and trophic levels are not. The team at MVCO will is starting to piece together parts of the coastal food web of phytoplankton, and their ongoing time series will be critical to predicting coastal picocyanobacteria dynamics in the future.
—by Sidney Gerst
Hunter‐Cevera, K. R., Neubert, M. G., Olson, R. J., Shalapyonok, A., Solow, A. R., & Sosik, H. M. (2019). Seasons of Syn. Limnology and Oceanography.